

1. INTRODUCTION
2. THMC PROCESSES IN BENTONITE BARRIERS
3. PRINCIPLES OF X-RAY COMPUTED TOMOGRAPHY
4. CHARACTERIZATION OF BENTONITE PELLETS AND POWDER
5. EVALUATION OF THE PERFORMANCE OF BENTONITE MIXTURES AND BLOCKS
6. OBSERVATIONS OF THMC PROCESSES IN BENTONITE USING X-RAY CT
7. SUMMARY AND FUTURE WORK
8. CONCLUSIONS
1. INTRODUCTION
In the concept of deep geological disposal of high-level radioactive waste, the Engineered Barrier System (EBS) consists of a canister that contains the spent nuclear fuel, backfill, buffer, and gap-filling material (Booker et al., 2004). The canister is placed in vertical or horizontal disposal well drilled on the floor or wall of the disposal tunnel, and the space between the canister and the well inner wall is filled with compressed bentonite buffer material. When all of the disposal wells excavated in the disposal tunnel are full, the disposal well and connecting tunnels are filled with a backfill material, which is a mixture of bentonite and sand or bentonite and crushed stone, and then the disposal site is closed (Cho et al., 2019). The buffer material is a material installed between the disposal container and the natural rock surrounding it. It blocks the discharge of radionuclides physically, chemically, hydraulically, and biologically by completely blocking the disposal container, and it plays a role in protecting the disposal container from the deformation of the surrounding rock. The backfilling material plays a role in hydraulically isolating the EBS, maintaining the buffer material in an intact state, and mechanically stabilizing the surrounding entrance shaft.
Clay minerals are the main component of bentonite, which is mainly used for cushioning and backfilling materials. Also, clay minerals have characteristics that change according to the environment. Important factors negatively affecting the long-term performance of bentonite cushioning materials include reduction of swelling amount, formation of fast flow paths, deterioration of sorption performance, and increase of saturated hydraulic conductivity. In the long-term performance evaluation, it is necessary to evaluate the potential change in the properties of the cushioning material over time. In particular, depending on the difference in material properties such as the dry density, swelling characteristics, etc., different swelling pressures may result during operation, and heterogeneities in the physical properties may appear. In particular, since the thermal-hydrological-mechanical-chemical (THMC) properties of bentonite change significantly when the dry density changes, it is important to evaluate the changes in those characteristics and the inhomogeneity of the cushioning backfilling material in EBS according to the disposal environmental conditions.
In this review, we offer an overview of studies over the last decade that have focused on the characterization of bentonite materials using X-ray Computed Tomography (CT). This non-destructive technology has allowed to evaluate the physical characteristics and properties of bentonite and bentonite mixtures that are candidates for sealing radioactive waste disposal. Moreover, in recent years, this technology has also been used to monitor the evolution of bentonite properties subjected to hydration and temperature change. Then, these examples show the capabilities and current direction of the usage of X-ray CT technology in the study of bentonite materials for EBS.
2. THMC PROCESSES IN BENTONITE BARRIERS
Bentonite material undergoes various processes when placed as a barrier between the geological media and the canister containing spent nuclear fuel. The concept of High Level Nuclear Waster repository developed by the Swedish Nuclear Waste Management Company (SKB) considered the following processes illustrated in Fig. 1 (Sena et al., 2010). The main transport mechanisms of radionuclides are diffusion and advection during saturation, and they will be dominant until the bentonite is fully saturated. At the same time, bentonite will be affected by the thermal gradient exerted by the radioactive decay of the spent fuel. As the saturation and the thermal effect act on the bentonite, they trigger other chemical processes. Marty et al. (2010) carried out a numerical simulation of the long-term behavior of the alteration of bentonite as an engineered barrier in underground radioactive waste repositories. They showed that the interaction of the geological groundwater influenced the corrosion of the steel overpack, mainly affecting the outer parts. On the other hand, the simulation showed that the dissolution of montmorillonite in the bentonite mainly occurred in the zone adjacent to the rock mass. At the laboratory scale, Chang et al. (2021) showed how the thermal effect induced heterogeneous changes on the dry density, especially in zones near the heat source. Then, the interaction of these coupled processes considering the THMC characteristics of each site needs further investigation for better repository models that can respond to most of these challenges.
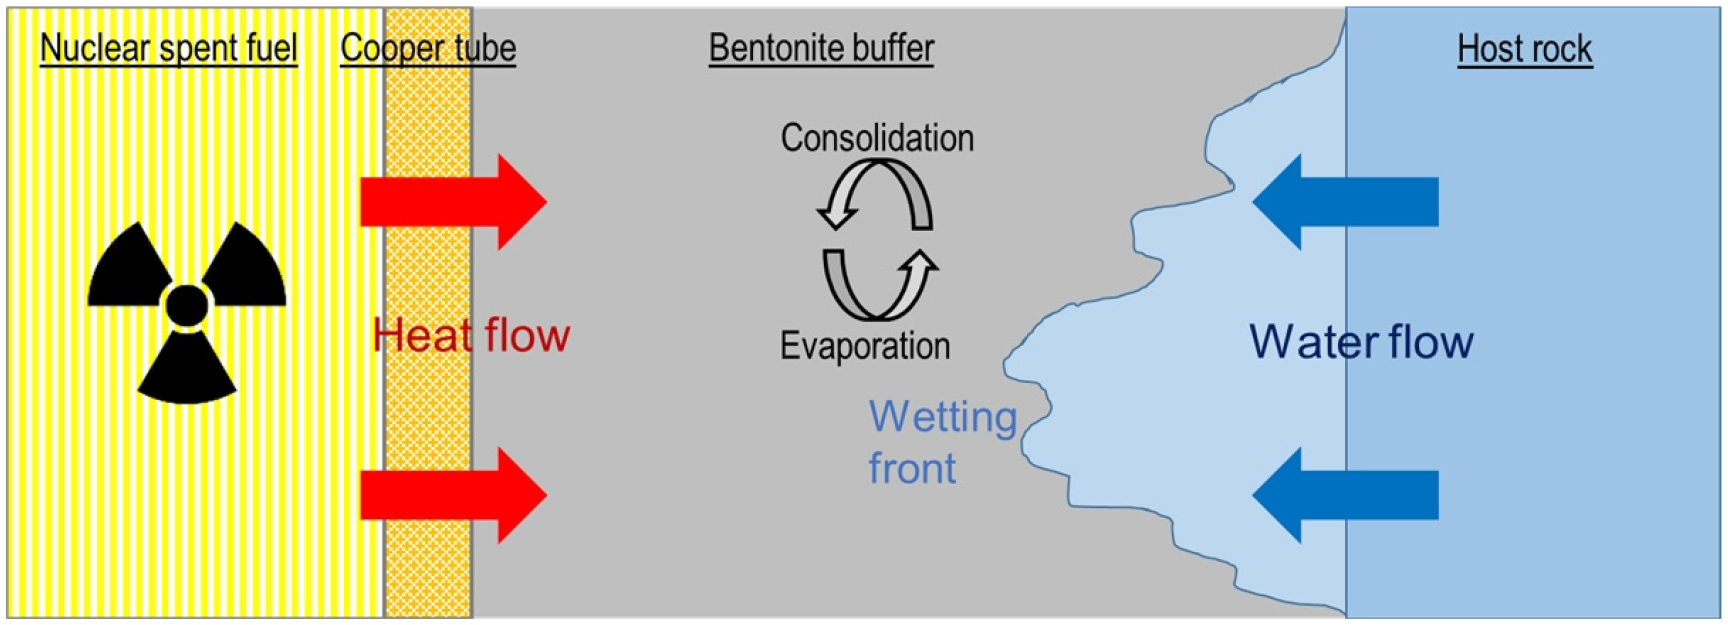
Fig. 1.
Schematic of the thermo-hydraulic and transport processes that can occur during the saturation period of the bentonite buffer in nuclear waste repository (Sena et al., 2010).
3. PRINCIPLES OF X-RAY COMPUTED TOMOGRAPHY
X-ray CT has been utilized in many industries due to its ability to penetrate materials to different degrees and render their internal structures. The degree of penetration can be mathematically represented using Beer’s law, which is expressed in Eq. (1).
where represents the X-ray beam intensity, and the function indicates the linear attenuation coefficient along the ray path . The linear attenuation coefficient is in positive linear relationship with the density and atomic number of materials but also energy dependent (Cnudde and Boone, 2013). One of the early applications of X-rays was in the medical field, thanks to the experiments carried out by Frost (1896) among others. His experiments of scanning multiple objects, including a human hand after 20 minutes of exposure, opened a world of applications of this technology. Different from the medical field, applications of X-ray in the geosciences appeared later in the last century. Ketcham and Carlson (2001) addressed the characteristic conditions and challenges of dealing with geomaterials. X-ray CT applications have increased over the last decade, and technology has expanded to even monitoring laboratory experiments in real time by tracking different physical properties (Mees et al., 2003, Xiao et al., 2012). For reference, a photograph of a typical micro X-ray CT equipment is shown in Fig. 2(a). Fig. 2(b) shows a schematic of the typical laboratory scanning of a rock core sample. A rock sample sits on a rotating table, and moves angularly at a predefined speed. The X-rays coming from the source either pass near or through the sample, and reach the detector panel where the image is reconstructed. Cases A and B exemplify the influence of the source-object-distance (SOD) on the resolution of the final image, where a short SOD can provide a higher resolution.
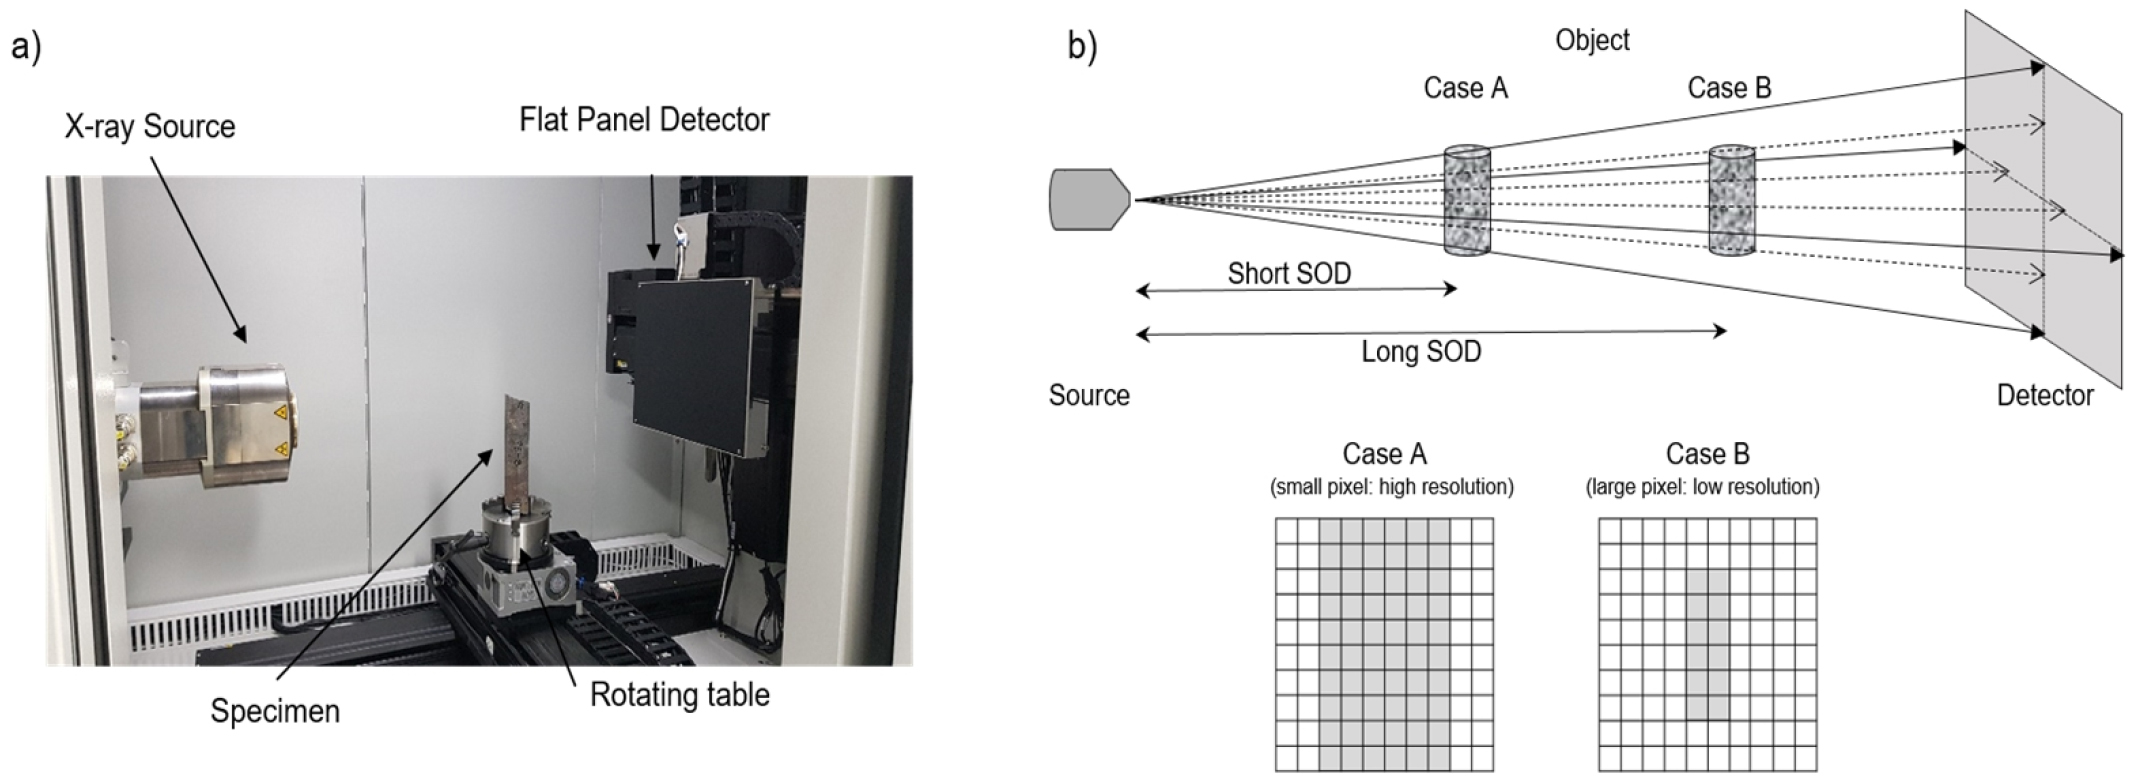
Fig. 2.
a) Photograph of the micro X-ray CT equipment at Korea Maritime and Ocean University (KMOU). b) Schematic of a typical micro-CT scanning setup with a conical X-ray beam. Cases A and B indicate samples placed at different source-object-distances (SOD) from the source and their resultant image resolution.
4. CHARACTERIZATION OF BENTONITE PELLETS AND POWDER
The wide application range of the X-ray CT technique has also covered the characterization of bentonite as a sealing material for underground radioactive waste repositories. One of its first applications on the characterization of bentonite was conducted by Tomioka et al. (2010), when compacted montmorillonite samples were examined under dry and wet conditions. The bentonite was the Na-type montmorillonite, which was later purified and compacted to a dry density of 1 g/cm3 within tubes of 5 mm in diameter and 10 mm in height. The authors employed a micro-focus X-ray CT (SkyScan-1172), with a voltage of 50 kV and an aluminum filter of 0.5 mm in thickness. The rotation was divided into steps of 0.1 degrees, and the image acquisition took nearly 16 hours per sample. A typical X-ray CT cross-section of the samples is shown in Fig. 3. The montmorillonite particles were identified as particles with an elliptical shape. Moreover, glass spheres of known dimensions were added to calibrate the later image analysis, and they were also clearly identified in the X-ray CT cross-section images. With the development of a computer code, the authors determined the grain boundaries from the images (Fig. 3). This process allowed to compute the number of montmorillonite grains per CT slice, as well as the grain's size and shape. Later, after saturation, X-ray CT imaging offered a closer look at the swollen particles and the tracking of the added glass spheres. From this analysis, the authors concluded that the outer montmorillonite sheets swelled and formed a gel, while the inner sheets showed little change during the saturation.
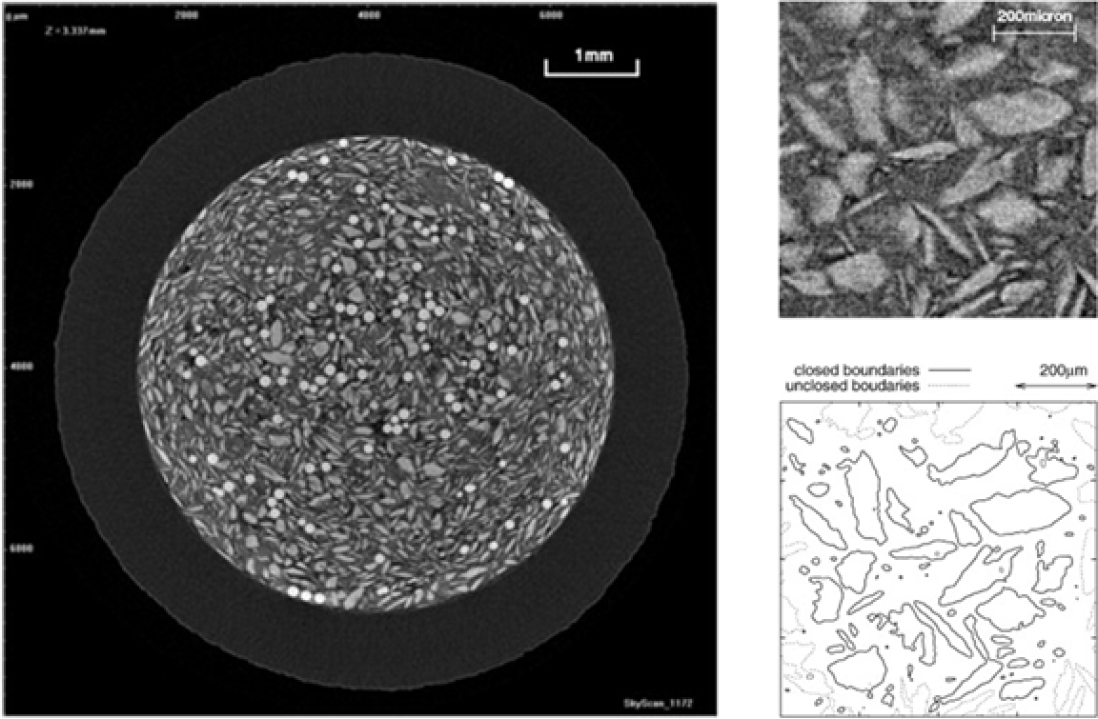
Fig. 3.
Typical X-ray CT slice of a dry montmorillonite sample along with subregions to exemplify the process of grain boundary determination based on a computer code (Tomioka et al., 2010).
On the other hand, Molinero-Guerra et al. (2017) employed micro CT equipment (“Ultratom”) to characterize MX80 bentonite in the form of pellets and also mixtures of pellets and powder. The bentonite pellets had an average height of 5.72 mm and diameter of 7.14 mm. The CT scanning of pellets was carried out under the following conditions: 80 kV, 40 μA, projections every 0.25 degrees, and a voxel size of 4.4 μm. Similarly, the scanning conditions for the powder/pellet samples were: 100 kV, 25 μA, projections every 0.125 degrees, and a voxel size of 59 μm. Fig. 4 shows CT slices at different heights that revealed heterogeneities within the pellets. The gray values in each section are related to the density of each section, with lighter areas representing denser materials and black areas corresponding to voids. Crack sections observed in sections I and II in Fig. 4 were also observed in other pellets, and 3D rendering images showed how these cracks form networks within pellets. Moreover, micro CT technique allowed to estimate the suction, water content, and dry unit mass. Molinero-Guerra et al. (2017) also analyzed the spatial distribution of pellets in mixtures of bentonite pellets and powder. The powder was obtained after crushing the pellets, and the mixture has maintained a constant composition of 80% of pellets and 20% of powder. The authors reported that the estimates of the distribution of the pellets depended upon the selected CT threshold. However, the characterization of larger samples of bentonite mixtures often did not detect smaller pores or cracks within the pellets as those shown in Fig. 4. Nevertheless, X-ray CT imaging provided a way to qualitatively characterize larger voids within the larger samples of bentonite mixtures. The results were reported as the changes of void ratio along the sample height.
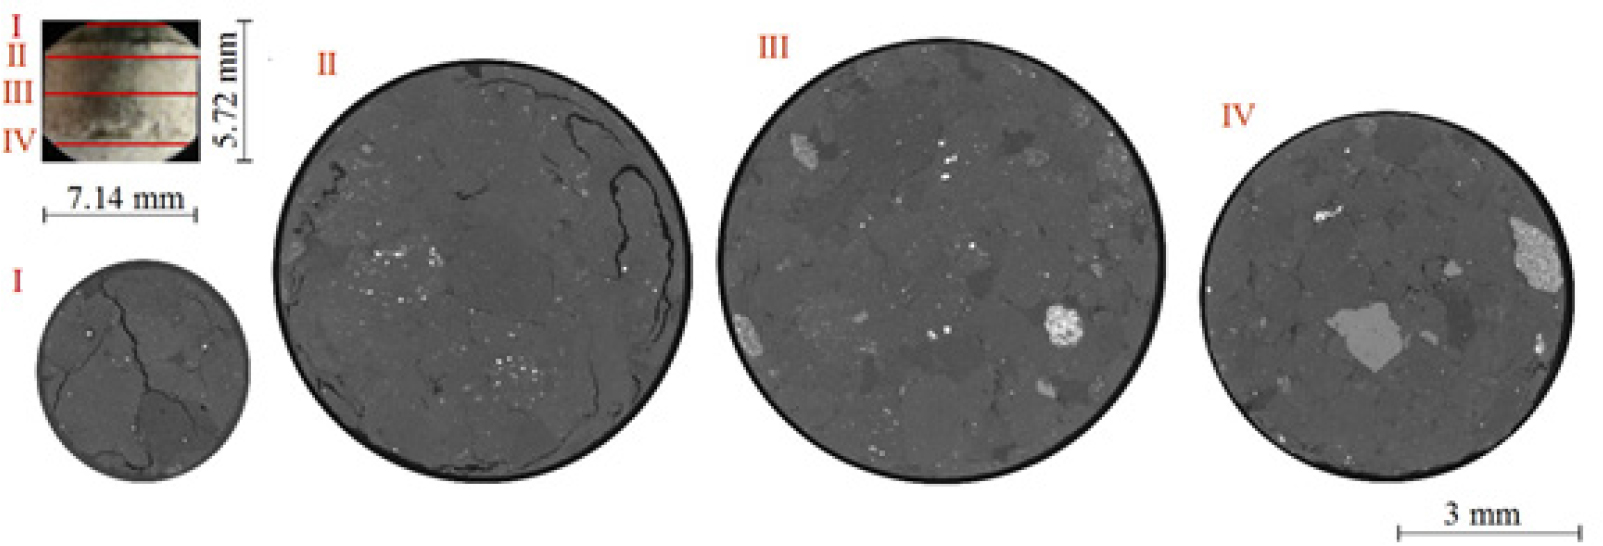
Fig. 4.
Micro X-ray CT cross-sections of MX80 bentonite pellet in its original condition (Molinero-Guerra et al., 2017).
X-ray CT has also been used to estimate the porosity of other mixture materials. Saba et al. (2014) studied the radial and axial swelling pressures in disks of mixtures of bentonite and sand as sealing plug materials in radioactive waste disposal. The samples were prepared with 70% Wyoming MX-80 bentonite and 30% quartz sand. Besides the mechanical tests, where the swelling pressure of the disks was monitored, the authors also employed a micro X-ray CT equipment (“Ultratom”, Ecole des Ponts Paris Tech) to examine the spatial distribution of the porosity at different locations along with the horizontal and vertical directions by using square subregions, as shown in Fig. 5. The porosity was calculated after applying a filter that segmented the bentonite from the pores. Then, the porosity resulted from dividing the number of black voxels (pores) into the total number of voxels. The results in Fig. 5 show a difference in porosity values between the regions at the borders and those at the center. This difference was attributed to the preparation process of the samples. After hydration, the authors also examined the swelling of the samples through X-ray CT imaging and confirmed differences in regions with swollen bentonite particles and others with more or less intact particles.
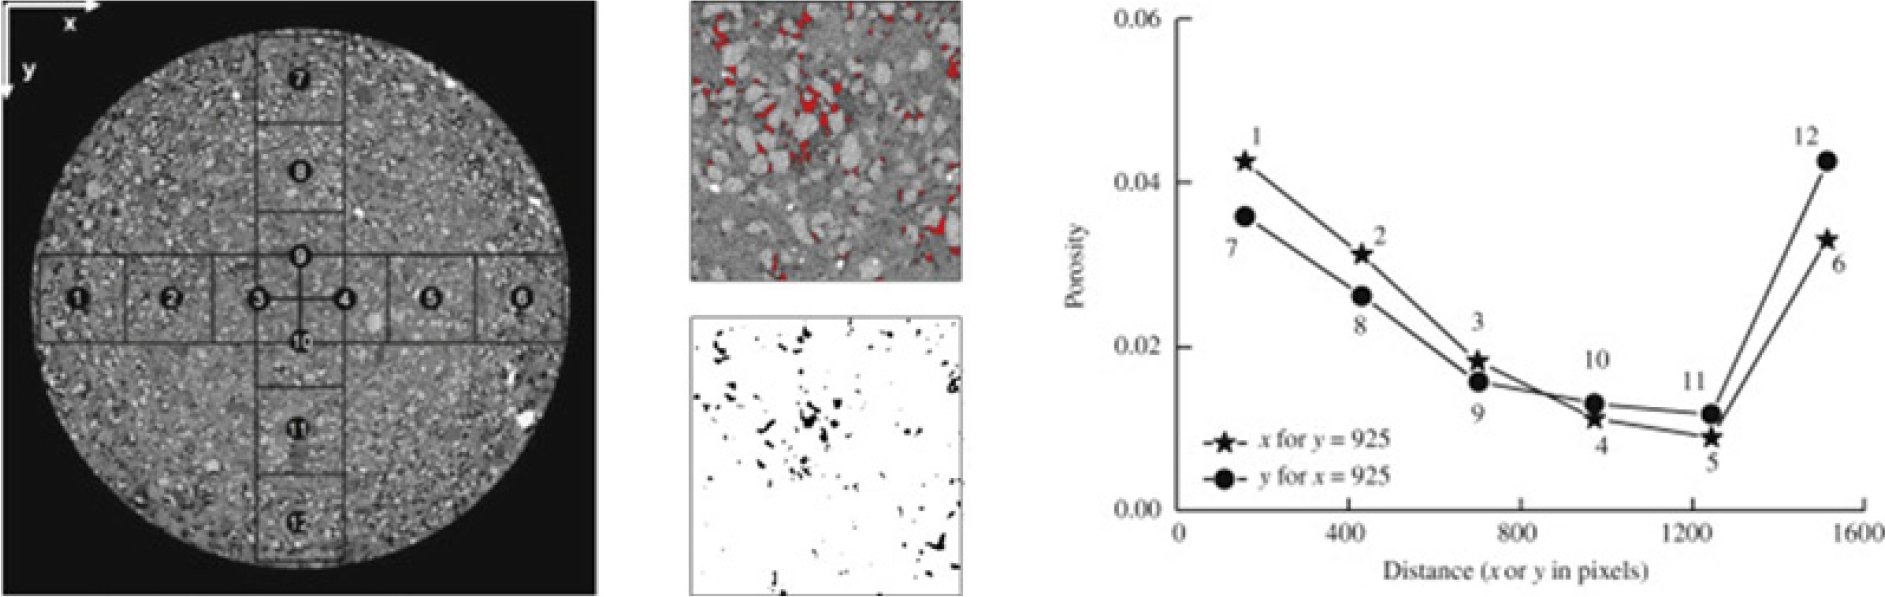
Fig. 5.
Process of porosity calculation based on X-ray CT images of the bentonite sample using subregions. CT thresholding was used to estimate the porosity within each subregion. The resultant porosity data was shown as a function of distance along the vertical and horizontal axis (Saba et al., 2014).
5. EVALUATION OF THE PERFORMANCE OF BENTONITE MIXTURES AND BLOCKS
X-ray CT technology has also been used to observe the evolution of pellet-powder mixtures upon wetting. Molinero- Guerra et al. (2018) carried out an experiment on a cylindrical cell of transparent polymethyl methacrylate of 60 mm in diameter and 120 mm in height. The material was selected because it eases X-ray CT scanning. The “Ultratom” micro-CT equipment from RX solutions (France) was used in this study. Each sample scan took 19 h, and delivered images with a voxel size of 50 μm. The cell was filled with a mixture of pellets and powder with a ratio of 80 to 20, respectively, and the density was verified using the mass of the bentonite with known water content and the cell volume. The experiment was conducted under constant-volume conditions using an axial piston that restricted movement due to swelling, and the swelling pressure was monitored with a transducer. The sample was saturated from both the top and bottom. Fig. 6 shows vertical and horizontal cross-sections of the sample at different times. These observations allowed the authors to identify heterogeneities within the sample that dominated the saturation process. As the saturation continued, the bentonite started to swell, and the evolution of both saturation fronts was similar. By the end of the experiment, the material presented an apparent homogeneity when nearly all air voids had been closed. A closer look into this transition is shown at the right side of Fig. 6 where horizontal cross-sections of the sample at different times were taken at the sample height, 60 mm from the bottom. These images showed how swelling occurred first in the bentonite powder and later in the pellets. However, this process in the pellets was initiated with a progressive occurrence of cracks until the entire pellet swelled.
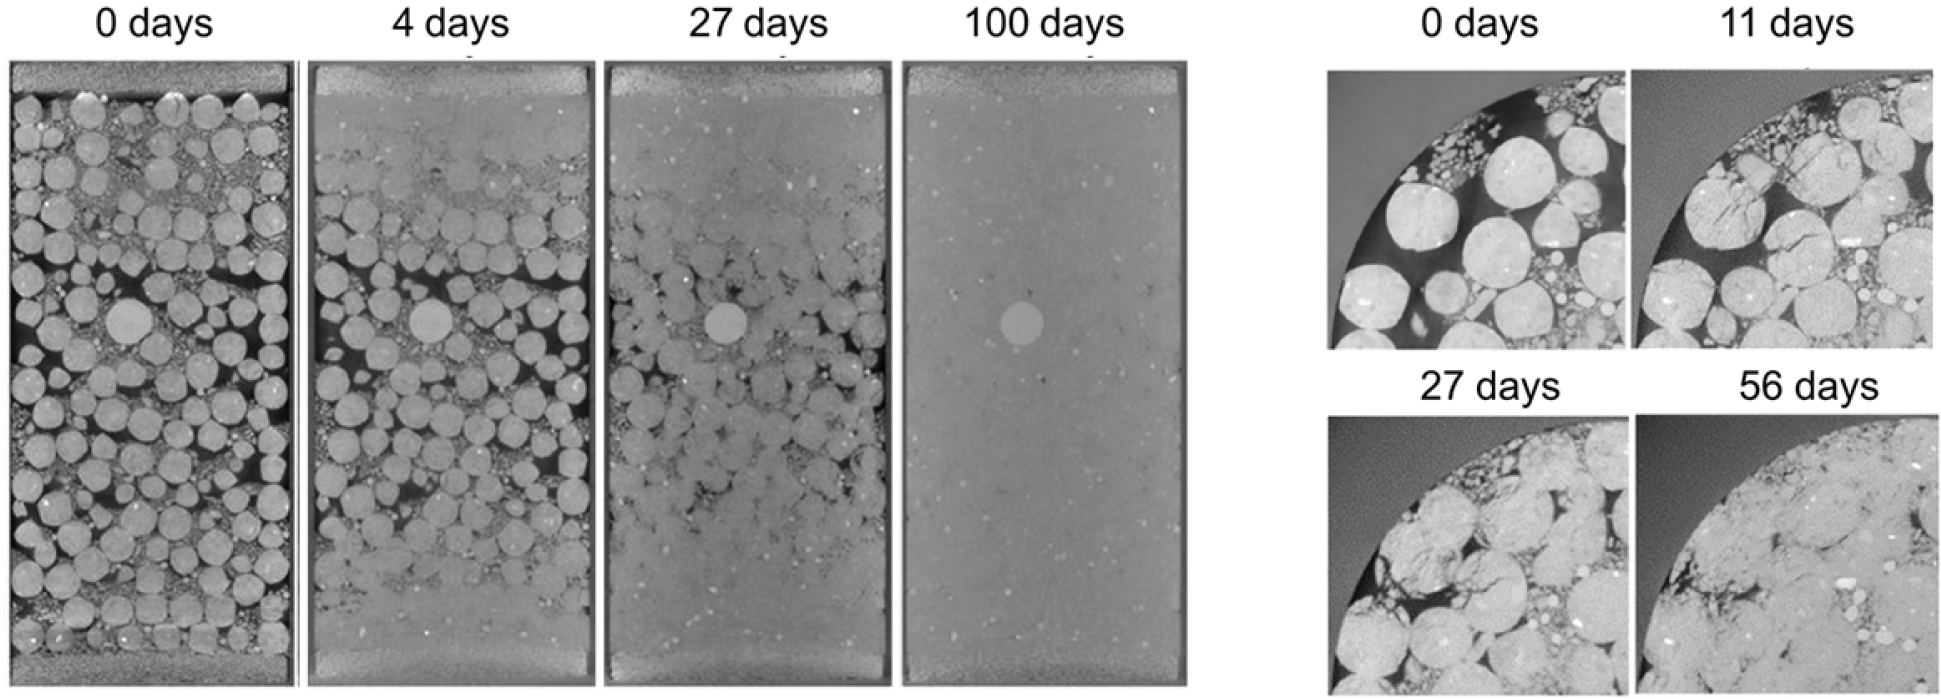
Fig. 6.
Vertical and horizontal X-ray CT cross-sections of the sample at different testing times. The horizontal sections at the right were taken at 60 mm from the bottom (Molinero-Guerra et al., 2018).
As a follow to the aforementioned study, Molinero-Guerra et al. (2020) performed an additional test with a more heterogeneous sample. The samples were prepared into two parts, the bottom half was composed of a mixture of 66.7% pellets and 33.3% powder at a dry density of 1.79 g/cm3, and the upper half with pellets only at a dry density of 1.19 g/cm3 (Fig. 7). The samples were scanned with a micro-CT equipment (“Ultratom”), along with a cooper plate filter of 1.5 mm of thickness to reduce noise. The scanning conditions were: 160 kV, 120 μA, 5760 projections in helical mode, and a voxel size of 50 μm. Both halves showed a clearly different behavior upon hydration, with the upper half indicating a faster swelling process in contrast to the lower half that was a mixture of pellets and powder. Moreover, the insert on the right in Fig. 7 shows a cross-section 10 mm away from the top, where the faster swelling process of the section composed of only pellets can be observed.
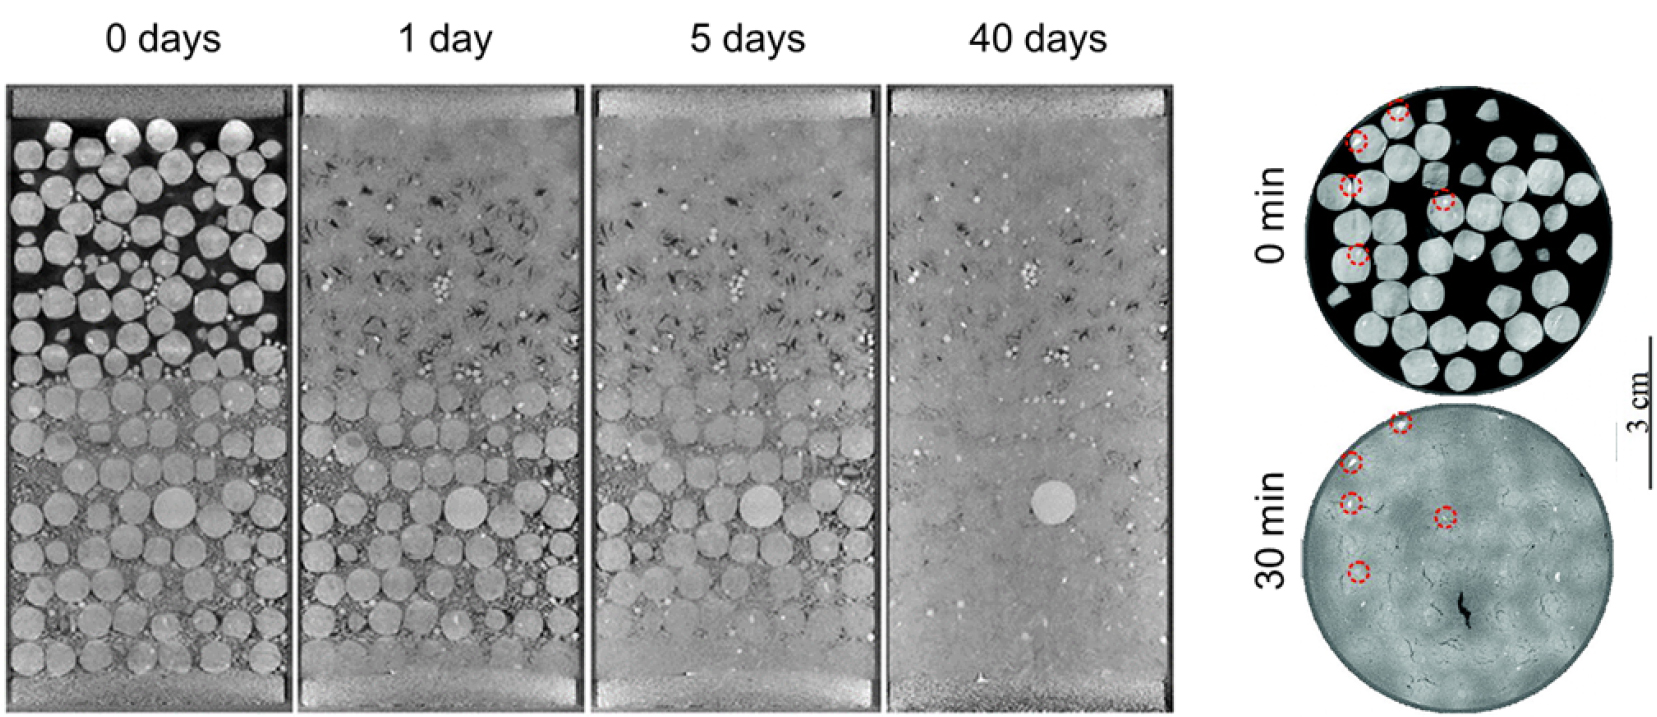
Fig. 7.
(Left) Vertical cross-sections of a second sample prepared with two distinctive halves. The bottom half was composed of a mixture of pellets and powder, while the upper was pellets only. (Right) Horizontal CT cross-sections 10 mm below the top of the sample, showing the swelling process of pellet-only part which is faster than that of the pellet-powder mixture part. Red subregions represent denser areas in the pellets (Molinero-Guerra et al., 2020).
CT imaging has also been helpful to estimate stresses during hydration and dehydration. Chen et al. (2020) applied a specialized image-based software to obtain the deformations of the bentonite samples using a Digital Volume Correlation approach. The samples were prepared using Gao-Miao-Zi (GMZ) bentonite from northern China. An initial cylindrical sample of 50 mm in diameter and 20 mm in height was prepared at a dry density of 1.72 g/cm3. Then, to ease X-ray CT imaging, two smaller samples of 4 mm and 8 mm of diameter and length were extracted to be parallel and perpendicular to the direction of compaction. The smaller samples were placed in plastic tubes with a hole from where the relative humidity was controlled to dehydrate and hydrate the samples. The scanning was carried out with a micro-CT equipment (ZEISS Xradia 410 Versa). Fig. 8 shows horizontal and vertical cross-sections along with strain estimates during dehydration. The CT-image-based technique allowed to obtain the global and local strains of the material and provided evidence of the shrinking process during dehydration with localized strain due to the sample heterogeneity. Moreover, X-ray imaging gave the opportunity to track the detailed changes in smaller regions during dehydration and hydration, as shown on the right of Fig. 8. Fissures between large grains and the matrix closed during drying and reopened during hydration. On the other hand, fissures within the matrix closed during the hydration process.
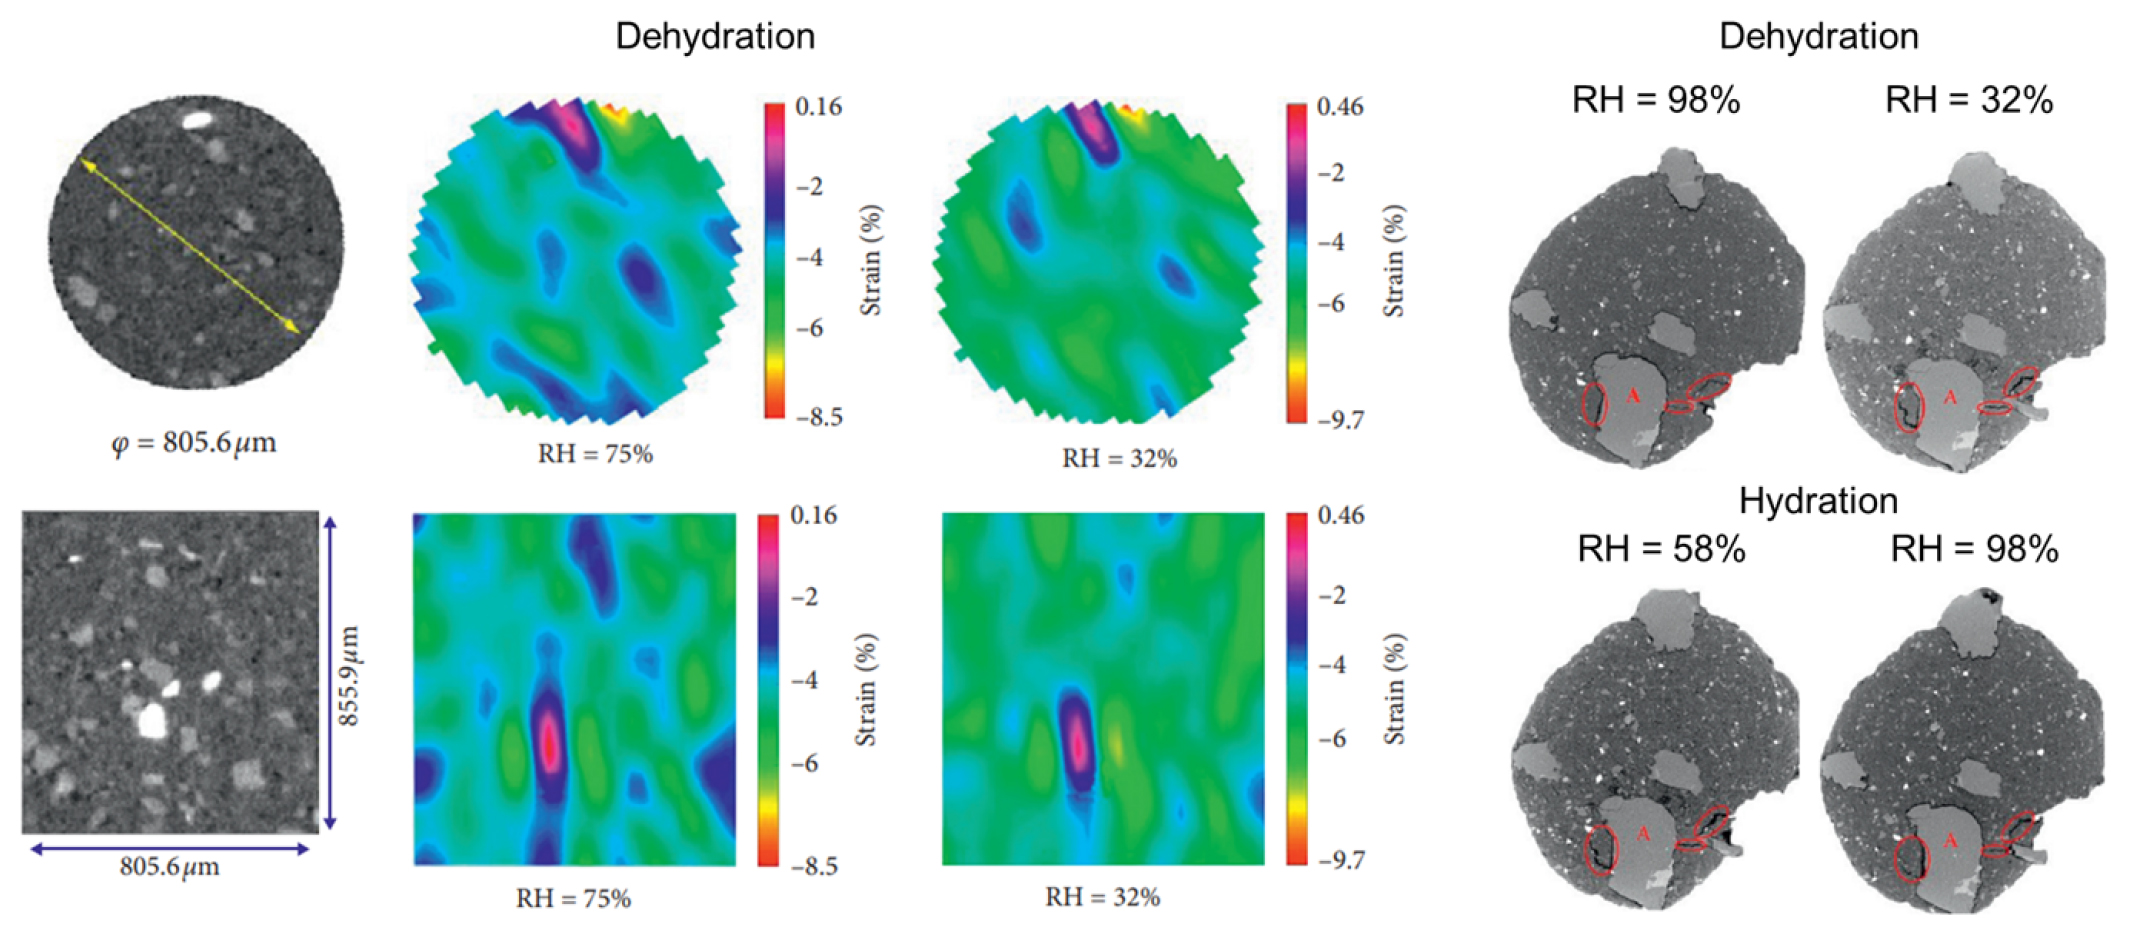
Fig. 8.
(Left) Horizontal and vertical sections of a bentonite sample during dehydration indicating strain fields, with positive values representing dilation and negative contraction. (Right) CT images of a smaller region during dehydration and hydration, indicating the relative humidity (RH). Red highlighted regions are included to follow the behavior of the crack during hydration and dehydration (Chen et al., 2020).
Bernachy-Barbe et al. (2020) evaluated the performance of mixtures of MX80 bentonite pellets and powder under axial hydration and using different cell sizes. The proportion of pellets was between 70% to 80%, and the remaining was composed of bentonite powder obtained after crushing. The samples were prepared at a dry density of about 1.5 g/cm3. Among the tested cases, a large sample of 240 mm in diameter and 105.4 mm in height included radial pressure and relative humidity sensors, and their measurements were later contrasted with CT observations. The hydration was unidirectional, from the bottom to the top. The odometric equipment measured axial force and displacement. This test lasted for 1214 days and recorded a 3.84 MPa axial swelling pressure. After testing, six cores of 30 mm in diameter were extracted directly from the cell for further testing, such as water content and dry density. The obtained values are reported in Fig. 9, where the water content was higher at the bottom, near the injection point. On the other hand, four samples were taken for X-ray CT scanning using a GE phoenix equipment, under the following scanning conditions: 200 kV, 180 μA, and 2200 projections. As a way to quantify the changes in the density along with the sample height, average values of five vertical CT slices were computed, and the results are also shown in Fig. 9 (right). Then, the X-ray observations of these four samples indicated a vertical density gradient due to hydration, with relatively lower values near the hydration source that correlated with direct measurements of water content and dry density. Finally, the variations of water content and dry density at the same height were attributed to local heterogeneities.
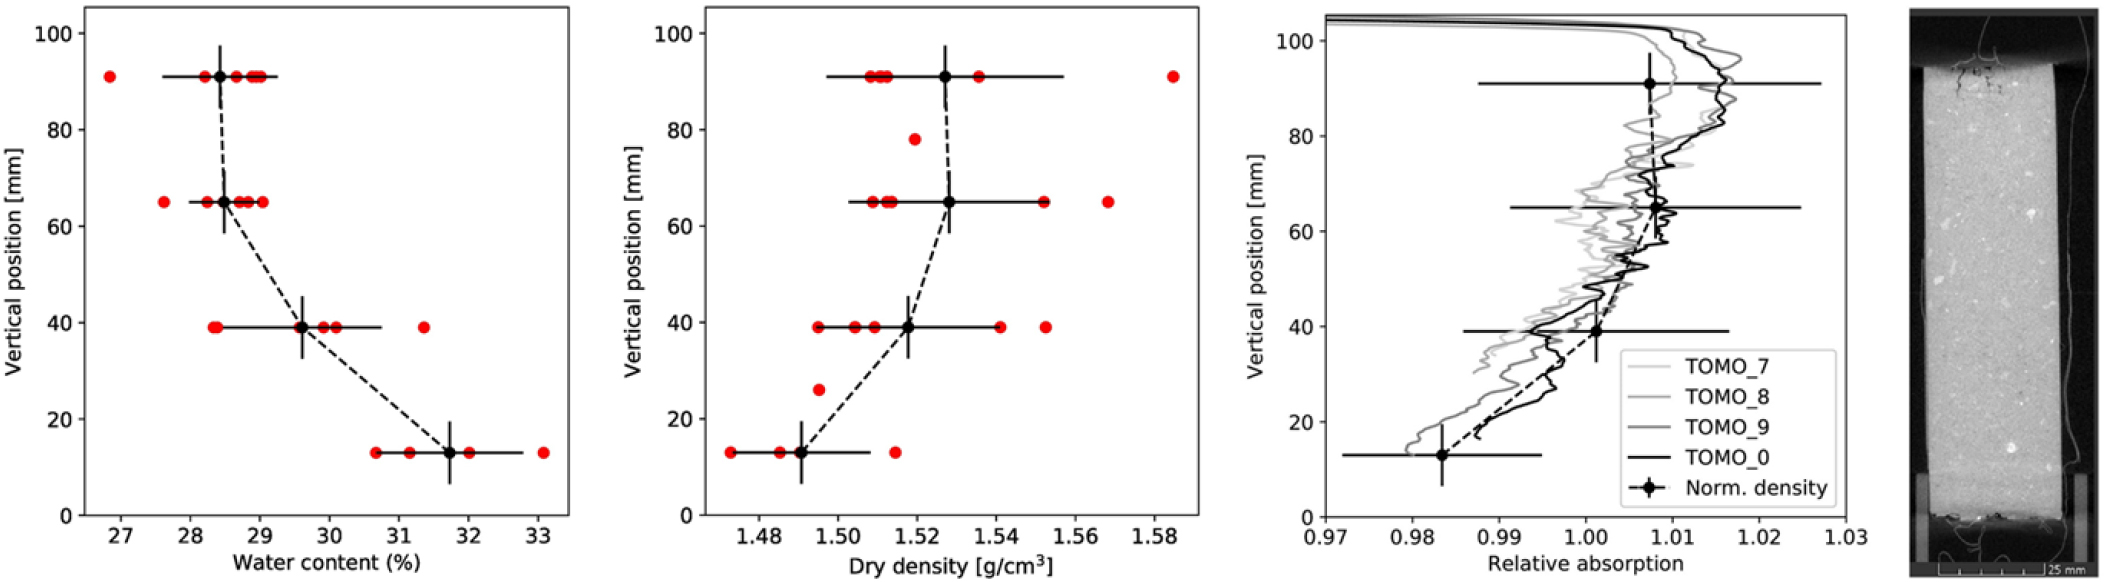
Fig. 9.
(Left) Profiles of water content and dry density measured directly after testing. (Right) Vertical profiles of fours samples showing normalized gray values along with an example of X-ray CT profile of the smaller cores obtained from a larger sample (Bernachy-Barbe et al., 2020).
Moreover, X-ray CT has also served to characterize the performance of bentonite blocks, which is an alternative to speed up construction as the blocks are manufactured beforehand and installed directly. Tan et al. (2021) examined the hydro- mechanical behavior of sand-bentonite blocks made up of GMZ bentonite and quartz sand. In order to properly characterize the block, the authors prepared five cylindrical samples with different densities from 1.7 to 2.2 g/cm3. Then, the average CT number in Hounsfield units (HU) was plotted against the density (Fig. 10). From this, a clear relationship was observed and was later used to estimate the density at different points within the large block based on the CT values. Then, a freshly prepared radial block was taken for X-ray CT scanning. The spatial resolution of the CT equipment was 0.208 mm. Due to its dimensions of approximately 305 mm in the radial direction, the block was cut into three parts to facilitate the CT scanning process. The results of the CT numbers and density estimates along the radial direction are also shown in Fig. 10. The CT values ranged within 70 HU, indicating a less than 0.1 g/cm3 density variation. This was an important parameter as it is related to the quality control of the blocks during manufacturing because significant density variations, especially at the edges, may cause localized swelling zones.
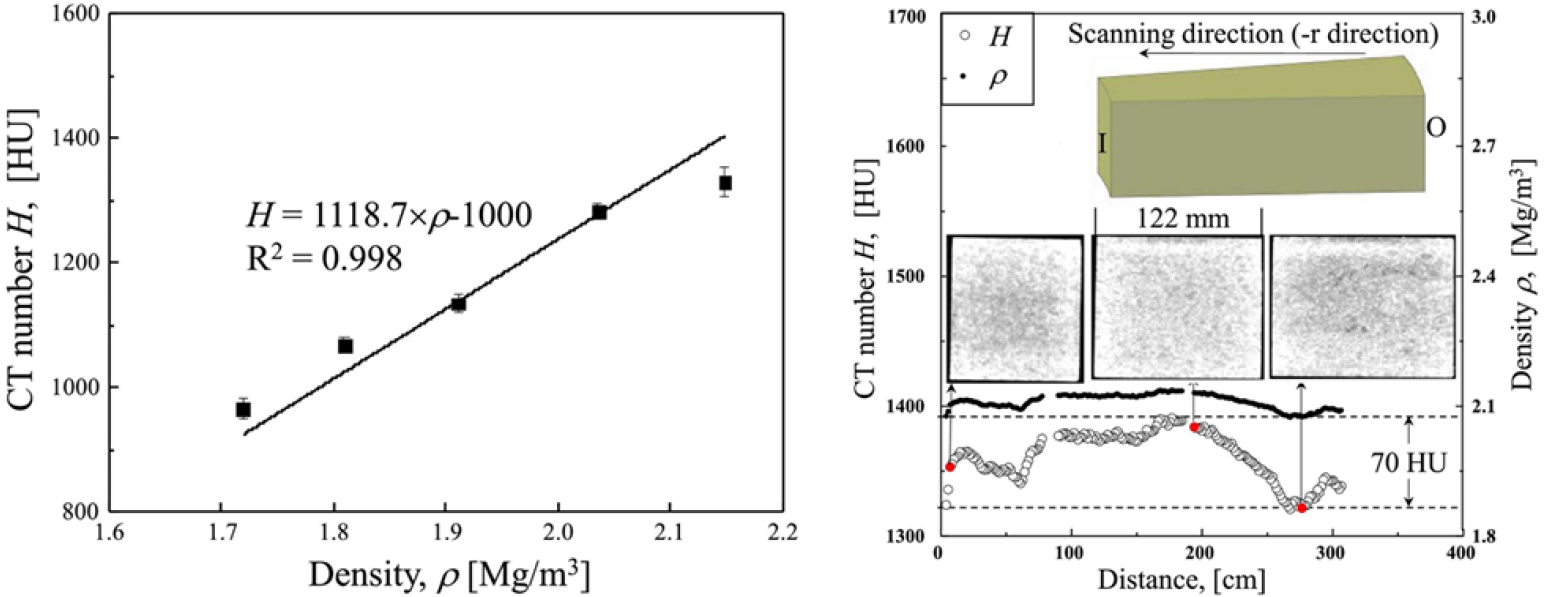
Fig. 10.
Linear relation between the average CT number and the density of bentonite-sand mixtures, along with the CT number as well as density against the distance from the inner (I) to the outer (O) diameter. (Tan et al., 2021).
6. OBSERVATIONS OF THMC PROCESSES IN BENTONITE USING X-RAY CT
X-ray CT technology has also been used to characterize THMC (thermal, hydrological, mechanical, and chemical) changes in Bentonite samples upon hydration and heating conditions. Bernachy-Barbe (2021) calculated the dry density, water content, and displacement at different hydration times based on CT images. The study employed MX-80 bentonite manufactured by Laviosa MPC and provided in the form of 7 mm pellets. Some pellets were crushed to obtain bentonite powder and then cylindrical and block samples were prepared with different densities. The cylindrical samples had a geometry of 57 mm in diameter and around 45 mm in height. A total of six cylindrical samples were prepared by mixing pellets and powder at different proportions. The samples were subjected to unidirectional hydration using synthetic water. The cell used for testing was equipped with multiple ports for sensors that eased the monitoring of values of relative humidity, total pressure, or interstitial pressure. During these tests, X-ray microtomography allowed to estimate water mass values that were contrasted with the recorded swelling pressure throughout the duration of the test, and the results of water mass showed a good agreement with the estimated water volume required to reach full saturation based on the dry density. The scanning was carried out with a GE Phoenix v equipment in helical mode, with a tube voltage of 210 kV, a current of 150 μA, a voxel size of 37 μm, and a scanning time of 90 min. Besides the water content, X-ray CT technology enables the computation of dry density and z displacement from the tracking of particles. Fig. 11 shows the evolution of the dry density, water content, and z displacement for one sample from day zero to day 37. Finally, CT technology aided in identifying and tracking the evolution of heterogeneities in the samples, which were more prominent at the onset of the test and decreased over time.
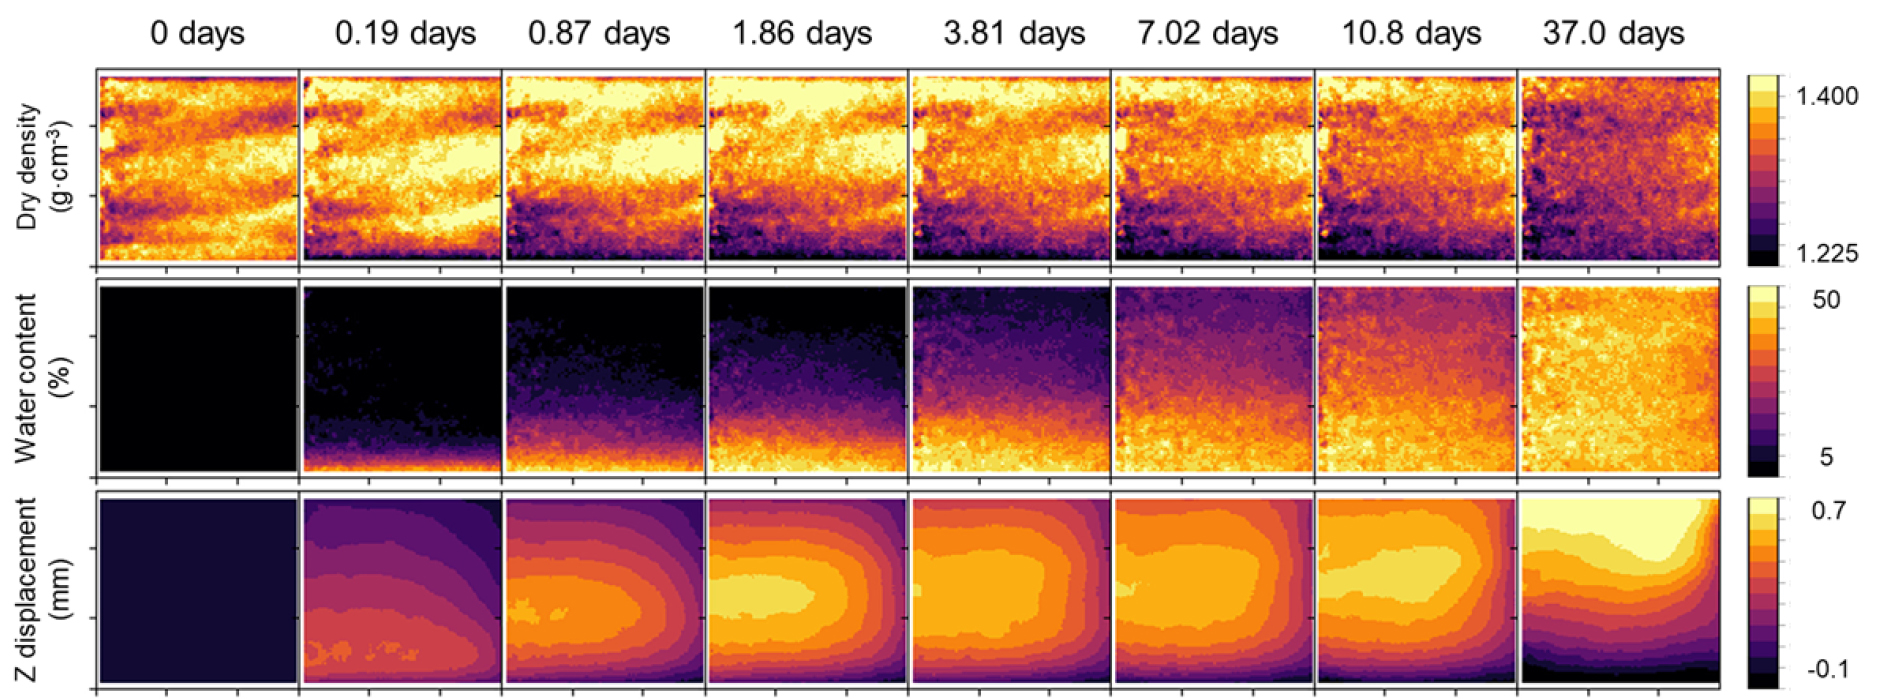
Fig. 11.
Results on dry density, water content, and vertical displacement of a bentonite powder sample at different time intervals. The injection flow direction is upwards (Bernachy-Barbe 2021).
Similarly, Chang et al. (2021) carried out experiments using Wyoming bentonite MX-80 to compare two conditions: a cylindrical sample under hydration only and a second identical sample under hydration and heating. The inner and outer diameters of the samples were 0.17 m and 0.19 m, with a height of 0.46 m, and they were prepared with a 0.17 and 0.18 water content for the non-heated and heated samples and a bulk density of 1.46 g/cm3 and 1.43 g/cm3, respectively. During testing, the samples were saturated using synthetic groundwater. The fluid was allowed to surround the samples through an exterior layer of sand, and constant fluid pressure of 0.827 MPa (120 psi) was maintained. This way, the authors secured an inwards fluid flow. Also, to maintain the same conditions, the central cartridge heater was installed in both samples. However, the temperature was set to 21 °C and 200 °C for the non-heated and heated tests. Also, the authors installed thermocouples at different distances from the heater to monitor temperature changes during the tests that lasted 255 days. The authors monitored the evolution of the bentonite samples and took multiple CT images using a General Electric Lightspeed 16 medical CT scanner. Fig. 12 shows CT density values on cross-sections of the samples at different days for the non-heated and the heated tests. These values were calculated during post-processing using the CT values. The changes in the density are due to the increase of the water content, and it is also dependant on the clay dry density. Then, X-ray CT imaging provided a great opportunity to follow these changes not only at specific cross-sections but also to compute the average dry density of the whole sample at different times. Finally, the authors reported how the CT slices were of great help to observe interesting changes in the heated sample, which showed more complex density changes with localized variations than the non-heated sample. In the end, X-ray CT technology revealed a difference in the CT density changes with time that although both samples showed initial rapid increments that converged over time, the heated sample indicated a slight decrease that was explained by the authors as a result of localized high-density zones preferentially located near the heat source.
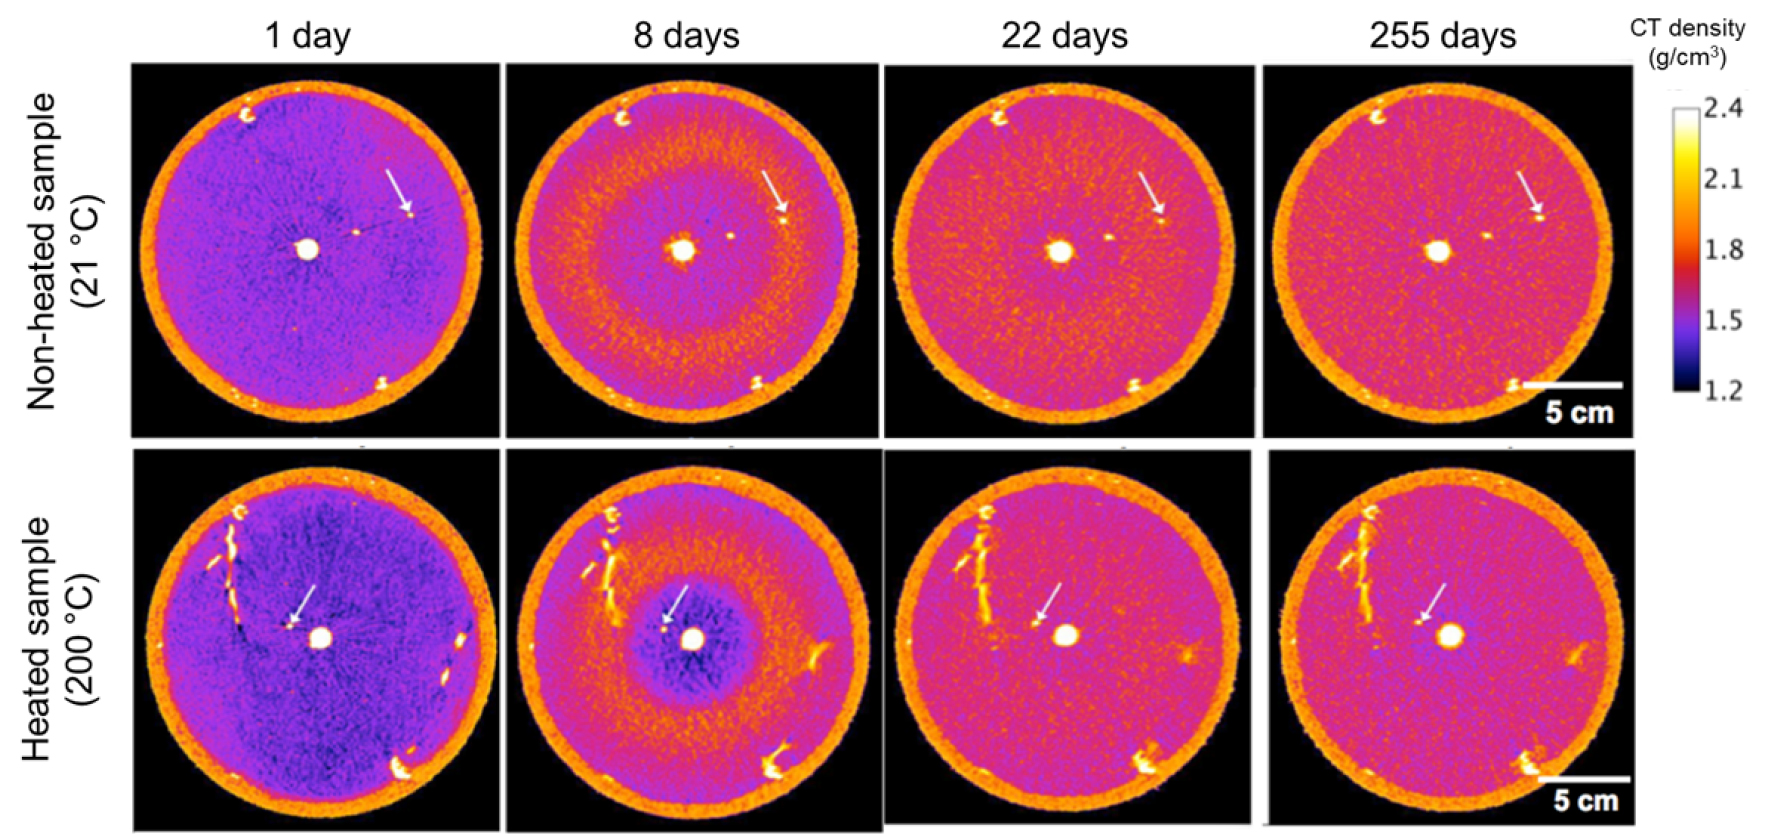
Fig. 12.
CT slices showing the thermocouple sensor's movement and the dynamic CT density changes on Wyoming bentonite for a non-heated and a heated sample. The arrows show the position of the thermocouple sensor (Chang et al., 2021).
7. SUMMARY AND FUTURE WORK
The aforementioned studies are examples of the applications of X-ray CT technology on the characterization of bentonite materials and also on the inspection of the evolution of physical properties during testing. These examples have shown how the density and the water content can be estimated from the CT images directly with a previous calibration. Then, measurements and inspections can be taken periodically to track the evolution of samples using X-ray CT technology. On the other hand, as South Korea is working on the development of safer radioactive waste repositories, it becomes essential to examine the performance of local bentonite materials under hydration and even thermal conditions. In this regard, we plan to do the testing of bentonite samples prepared with different dry densities and subjected to hydration. The experiments will be carried out with small samples that will fit within an X-ray CT chamber, and will allow constant monitoring throughout the tests. For these tests, we plan to use Gyeonju bentonite from South Korea, and evaluate its performance in different forms such as powder and pellets. Moreover, the investigation of the interface response between blocks of bentonite arranged in different presentations is also of interest. For example, Villar et al. (2021) studied samples with two phases of pellets and blocks subjected to hydration within a special transparent cell to ease periodical observation (Fig. 13). The results showed the importance of pores and spaces as the hydration was faster and heterogeneous in the pellets side than in the blocks. However, although the water content and dry density were measured at different points after testing, no information was collected during the test. Here is where X-ray CT technology can offer an advantage and provide a closer look into the performance evolution of the Gyeongju bentonite under different conditions, as shown in the studies presented above.
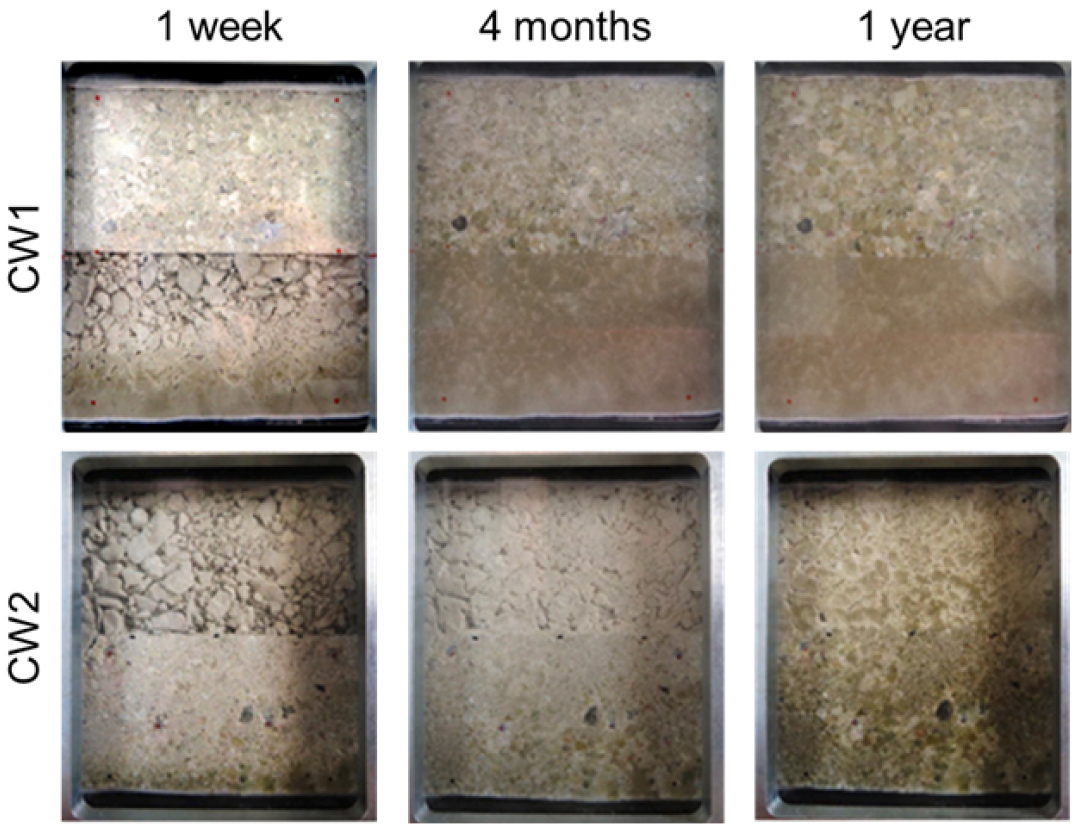
Fig. 13.
Comparison of the effects of hydration in samples CW1 and CW2. These cuboid samples were tested using a transparent cell under unidirectional hydration from the bottom (Villar et al., 2021).
8. CONCLUSIONS
An overview of the current usage of X-ray CT technology on the characterization and study of bentonite and bentonite- mixture materials as candidates for buffer, back-fill, and gap-fill materials for underground nuclear waste repositories has been presented. The applications of this non-destructive technology range from the characterization of the material, either in the form of pellets, mixtures of pellets-powder, or blocks before testing, up to the monitoring while testing when the sample is subjected to hydration and even thermal gradient. Specifically, X-ray CT technology has aided in identifying and automatically extracting grains at the micro-scale. In the case of pellets, CT tomography served to identify crack networks within pellets that contributed to the heterogeneity of the mixtures. Moreover, differences in CT values of bentonite material and air voids were used to compute porosity estimates of either localized areas or the entire sample. On the other hand, X-ray imaging has aided in characterizing the evolution of bentonite materials under hydration, regardless of the composition of the samples or proportions in the mixtures. For example, CT technology provided a closer look into the hydration of a heterogeneous sample and showed how areas filled with pellets only tended to swell faster as compared to those composed of pellets and powder. Also, CT observations aided in identifying the behavior of fissures between grains and bentonite matrix, which closed under drying conditions and expanded during hydration. X-ray CT technology has also served to estimate strain values with a given sequence of images, and the results were reported in 2D or 3D dimensions. Even for larger samples subjected to unidirectional hydration, X-ray CT offered a way to provide profiles of the density along the hydration direction. Blocks of bentonite have also been examined with X-ray technology, although larger samples were divided into shorter segments to ease scanning. Recent works have also obtained the dry density, water content, and displacement of particles from X-ray images at different times during more extended experiments. Finally, when the hydration occurs at a high temperature, X-ray CT technology can be a handy tool to observe and follow localized and global density changes and provide insights into the chemical process that occur.
