

1. INTRODUCTION
Discontinuities are the weak planes that arise in sets within a rock mass and separate the rock mass into discrete but interlock blocks (Jaeger and Cook, 1979). The failures of rock mass are prone to occur along these discontinuity planes. As a result, the existence of discontinuities can have a significant impact on the mechanical properties and behavior of a rock mass. In tunneling, the knowledge of the discontinuity network within a rock mass is crucial, since it affects the way that a tunnel has been designed and constructed. Traditionally, discontinuity mapping is performed on-site, which requires direct access to the tunnel face for the collection of the parameters of interest (orientation, spacing, persistence, roughness, aperture, etc.) (ISRM, 1978). For practical and safety reasons, traditional mapping is often carried out on limited sectors of the rock face and typically does not provide quantitative data for complete geometrical discontinuity mapping. Due to time restrictions, the operators usually quickly sketch out the discontinuities on the tunnel face based on their observations. This makes the results of manual mapping subjective rather than objective, and therefore not reproducible. Besides, the traditional approach is also limited by the knowledge and experience of the operator, biased interpretation and human error. Therefore, the interest in new methods for innovative methods for digitally mapping tunnel faces has greatly increased in recent years.
This study investigates the use of two typical remote sensing techniques i.e., terrestrial laser scanning (Lidar) and terrestrial photogrammetry for digital and contact-free measurements of discontinuity to address the drawbacks of manual tunnel face mapping. The main goal of these techniques is to create high accurate and high-resolution 3D models of tunnel faces, which can then be used for measuring the discontinuities indirectly. With the recent advancement in digital camera it is possible to obtain the high-quality image and modern computers also process a high amount of data within seconds, which promotes the application of these methods in the tunnel face mapping process.
2. METHODOLOGY
Lidar is a remote sensing technique that measures distance using light in the form of a pulsed laser. This technique is based on the time-of-flight method, which estimates the distances from the scanner to the targeting object by measuring the round-trip time that a laser pulse takes to reach the object surface from the scanner and return (Chazette et al., 2016). Recently, a Lidar scanner is usually associated with calibrated high-resolution digital cameras to texture the 3D model in true colors. One of the main advantages of Lidar is its ability to provide highly accurate and detailed measurements, with accuracy up to several millimeters. This level of accuracy, combined with the high density of the point clouds generated by the Lidar scanner, allows even the smallest features of the rock mass such as fractures or cracks to be detected. With the growth in range, Lidar is becoming a remarkable tool for geological surveying, particularly in inaccessible or hazardous areas. In this study, a Lidar device called BLK 360 is used to obtain a highly accurate 3D model of the tunnel face (Fig. 1(b)). This device provides an accuracy of up to 6 mm within the measure distance of 10 m. The 3D model obtained through Lidar scanning can then be used as a reference to compare with the 3D model generated through photogrammetry. By comparing the two models, it is possible to verify the accuracy of the photogrammetry model and ensure that it is an accurate representation of the tunnel face.
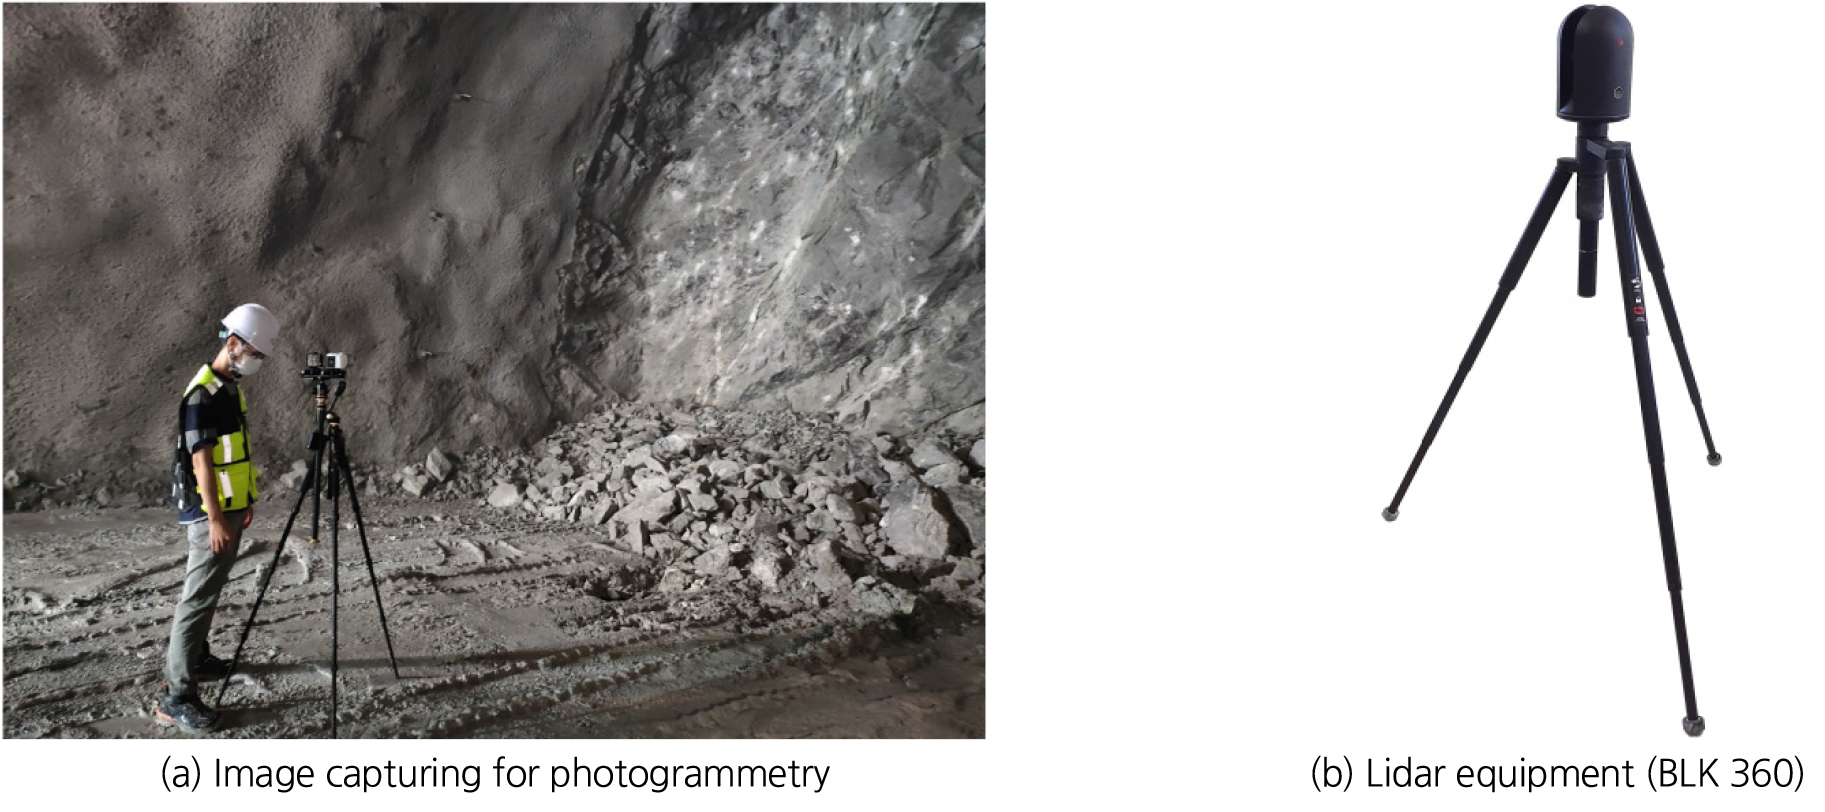
Similar to Lidar scanning, photogrammetry is a popular method for creating 3D representations of objects. This is a computer vision technique that uses the triangulation principle to generate a 3D model of the object from its multiple views in 2D images (Behan, 2004) (Fig. 1(a)). With the recent advancements in camera technology (both phone camera and digital camera) and computing hardware, the rock surface can be recorded as extremely high-quality images, which is then automatically and quickly processed by PC software to create 3D model of the rock face. This method has been applied for geological mapping (Dueholm, 1992), site characterization of rock exposures (Sturzenegger et al., 2009a, b, c) or 3D rock joint roughness measurement (Paixão et al., 2022), and more applications have been continuously developed in recent years. Numerous photogrammetry programs, both commercial and open-source, have been developed for 3D reconstruction yielding comparable results (Đurić et al., 2021). In this study, we used an open-source photogrammetric pipeline called Meshroom (Griwodz et al., 2021) to reconstruct 3D models of the tunnel faces from multiple images of the tunnel face captured with a digital camera (Samsung NX3000) and a phone camera (iPhone 12). These images were taken from various angles and positions respecting to the tunnel face with reasonable overlaps (at least 60%) and fixed camera setting i.e., low ISO of 200, aperture of f/10, and slow shutter speed of 1/9 due to the low light condition at the tunnel face (Fig. 2). Also, the images were taken at roughly 5 meters from the tunnel face and the 35 mm fixed-focus lens with the 20 megapixels large APS-C (23.5 × 15.7 mm) sensor was used, which together provided an estimated value for ground sampling distance (GSD) of approximately 6 mm/pixel. The ground sample distance (GSD) expresses the spatial resolution of the image. Given the high GSD, the photogrammetry method can provide a 3D model that is accurate to within a few centimeters. A point cloud with centimeter-level of accuracy and point density is enough to represent the detail structure of the tunnel face such as discontinuity. In general, the photogrammetry pipeline begins with identifying common feature points across the images by using scale-invariant feature transform (SIFT) algorithm. The feature points are consequently used to establish the spatial relationships between the original image including locations and orientations, simultaneously allowing for the calculation of the 3D locations of the feature points in the scene. The final result is 3D locations of these feature points in the form of a sparse point cloud in the same local 3D coordinate system (Griwodz et al., 2021).

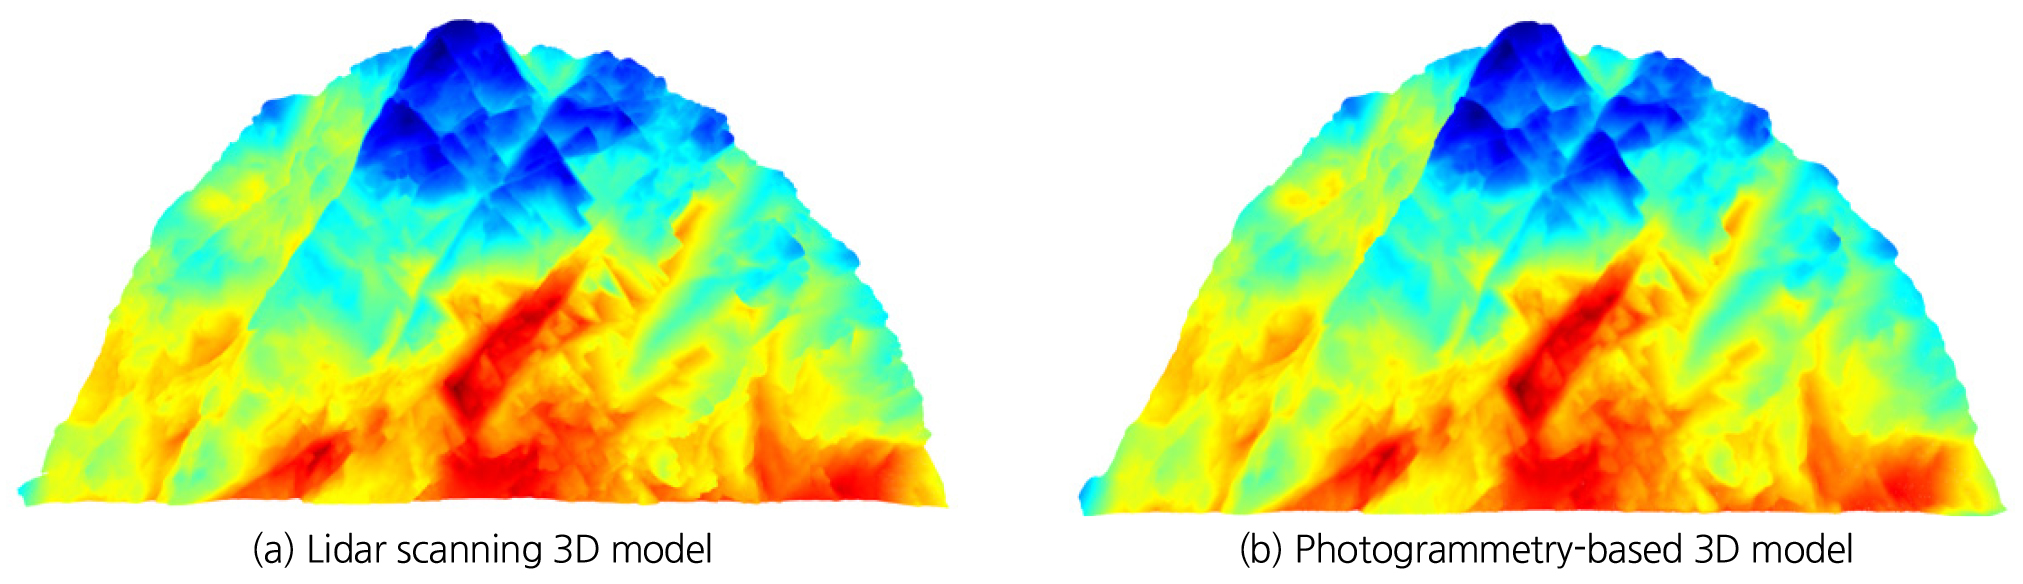
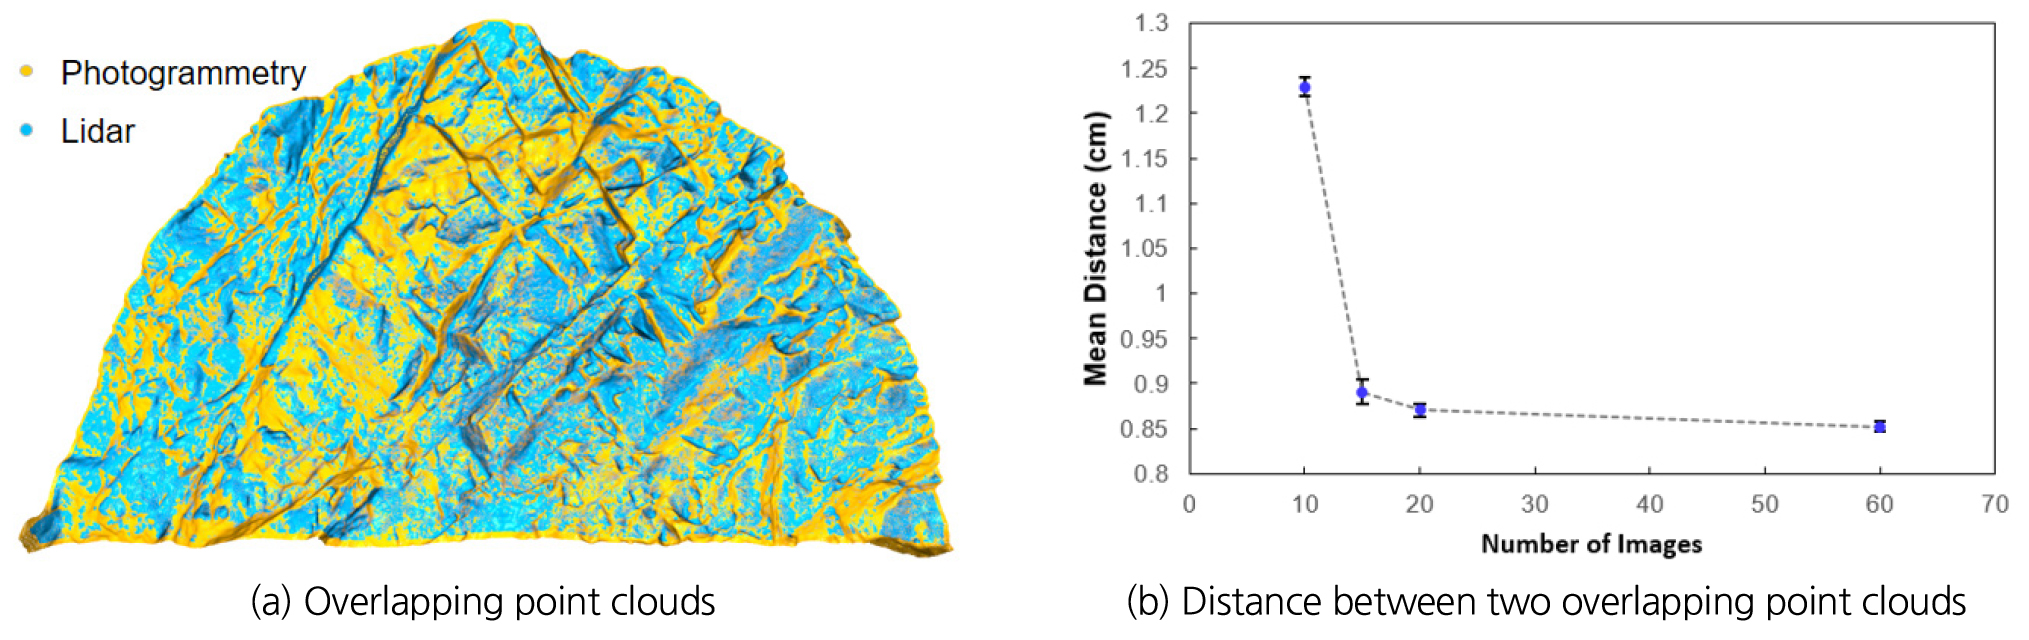
Fig. 3(a) and 3(b), respectively, depict 3D models of a tunnel face created using photogrammetry and Lidar techniques. The rock mass structures at the tunnel face are vividly highlighted. The oblique discontinuity sets can be observed in both 3D models. This result demonstrates that the 3D model of the tunnel face can be created by using the photogrammetry technique based on multiple view images taken at the tunnel face. The geometric accuracy of 3D photogrammetric model is further verified with the corresponding Lidar scanning model in term of the mean distance between them. Fig. 4 shows the two overlapping models after rescaling and automatic alignment using the iterative closest point (ICP) algorithm. The photogrammetry model is less detailed and smoother, whereas the Lidar model highlights a more intricate rock mass structure (Fig. 4(a)). The absolute distance between the two models is depicted in Fig. 4(b). We also investigate the effect of image number on the reconstructed model by reconstructing the same tunnel with the different number of images. In most cases, the distance is about 1 centimeter, which is negligible in comparison with the size of the tunnel. The result also shows that a smaller number of images may result in a larger difference between photogrammetry and Lidar models. In other words, the less accurate the photogrammetric model is. It is difficult to make a general statement about the optimal number of images to use in the photogrammetry pipeline, as it will depend on many factors, including the size and complexity of the scene, the quality of the images, and the desired accuracy of the resulting 3D model or point cloud (Tannant, 2015). In general, using more images will typically result in more accurate and detailed 3D models, but there is a point of diminishing returns where adding more images does not significantly improve the accuracy of the model. Overall, it is best to take as many high-quality images as possible, while also considering the surveying time as well as available computational resource for image processing. In our case, we can see that the optimal number of images is twenty, with a tunnel size of approximately 11 meters in width and 6 meters in height.
Finally, a semi-automatic method suggested by Riquelme et al. (2014) (Discontinuity Set Extraction - DSE) has been adopted to extract discontinuity sets from 3D point clouds produced by both techniques. This method works on the point cloud representation of the 3D model of the tunnel face. There are three major steps involved in this method. First, the local normal vector is estimated at each point within the point cloud. Next, the normal vectors are projected onto a stereonet for semi-automatic discontinuity analysis. In this step, the poles are assigned to the maxima on the stereonet, which represent the different discontinuity sets. Finally, all points in the point cloud are classified as belonging to a discontinuity set or not based on the angle between their normal vectors and the poles, with a manually-set angle threshold being used to make this determination. The result of DSE on the photogrammetric 3D model is shown in Fig. 5(a), (b). As there are four density maxima on the stereographic projections of the photogrammetric model representative of four different discontinuity sets. This result is similar to the measurements on the Lidar model. One issue with this semi-automatic method is that one of the maxima (J1) on the stereonet represents the entire regular tunnel face, which would result in the whole tunnel face being classified as a discontinuity set (Fig. 5(a), (b)). The remaining three discontinuities are fairly consistent with the results obtained from manual tunnel face mapping.

3. DISCUSSION
Lidar scan and photogrammetry techniques have been described with emphasis on their application to perform quantitative discontinuity mapping of the rock mass at the tunnel face during excavation. These techniques can be used to create detailed 3D models of the tunnel face during excavation, allowing engineers to identify discontinuity planes, weak rock conditions, or potential hazards and make informed decisions about the excavation process. The use of Lidar and photogrammetry in tunnel face mapping can provide several benefits, including reduced acquisition and improved safety conditions for operators as well as giving reproducible and objective results on discontinuity mapping. Because these techniques are fast and accurate, they can help to speed up the excavation process, reducing the amount of time and labor required to complete the tunneling project. As several methods have been proposed, it is also possible to automate the extraction of discontinuity plane information from the 3D model produced using these techniques, which will further cut down on the time and labor needed for data processing.
The comparison between two models produced by Lidar and photogrammetry technique has been illustrated in order to show the applicability of two methods especially photogrammetry as a cheap alternative of the Lidar scanning. Although, Lidar scanning model is shown to highlight a more complex rock mass structure when compared with the results of photogrammetry, the photogrammetry model is also adequate for identifying rock structures at the tunnel face. Table 1 highlights several advantages and disadvantages of each technique.
Table 1.
Lidar and photogrammetry comparison
In addition, it can be concluded from the analysis above that a free photogrammetry pipeline, like Meshroom, can be used to produce a 3D model of a rock face, offering an alternative to commercial photogrammetric software. Even with the lower-quality image taken by the phone camera, we can see that the reconstructed model is visually acceptable and comparable to the reference digital camera-based photogrammetric model. The model's surface point density is slightly lower, and the points are not evenly distributed across the model. This is most likely caused by the phone camera's smaller sensor size, lower resolution, and shorter focal length. As a result, more images may be required to obtain a higher-quality model. However, the fast image acquisition speed and acceptable point density, on the other hand, confirm that a phone camera can be used successfully for photogrammetric tunnel face digitization.
Regarding automatic discontinuity plane extraction based on the 3D reconstructed model, DSE seems to work to extract the discontinuity from the 3D model of the tunnel face with minimal human intervention. However, there are several problems with this method that need to be considered. First, the result is demonstrated to be highly sensitive to manually-set parameters such as neighbor number in normal vector estimation or the angle threshold used to assign points to discontinuity sets. Thus, DSE may also remove the small discontinuity planes with a small number of points. Furthermore, the algorithm may not perform well when identifying discontinuity planes that are not ideally planar, or when distinguishing between regular tunnel face plane and discontinuity plane. Finally, this method is only applicable for detecting discontinuity planes, but not for identifying discontinuities in the form of lines. Therefore, further research on automatic methods for detecting discontinuity planes in 3D models of rock faces is needed in order to improve the accuracy and reliability.
4. CONCLUSION
This study investigated the use of two 3D reconstruction techniques i.e., Lidar and photogrammetry in tunnel face mapping. Based on the result, the following conclusion can be drawn: (1) the Lidar scanning and photogrammetry methods both can be used for discontinuity mapping on the tunnel face with less time spent in acquisition and processing, as well as improved safety conditions for the operators. In general, the 3D models produced by these two techniques show well agreement; (2) Increasing the number of images can improve the photogrammetric model accuracy, resulting in a 3D model with higher point densities that is more similar to the 3D model from Lidar scanning. However, such an increase also implies a significant increase in computation times as well as the need for more intensive computational resources. Additionally, taking more photos means spending more time at the tunnel face and, consequently, more impact on the overall operation. (3) Despite the mentioned advantages, it has been demonstrated that the quality of 3D photogrammetry models can be affected by photograph condition, quality, and quantity of image. These factors must be considered when conducting the survey. (4) Further study on automating discontinuity extraction is needed to investigate the factors that can influence the accuracy and reliability of the result. This could involve the processing of the input data as well as the use of recently established supervised and unsupervised machine learning algorithms.
