

INTRODUCTION
SMOKE CONTROL FAN DEVELOPMENT FOR LARGE - OPENING MINES
Necessity of a smoke control fan in large-opening mines
Description of the smoke control fan for large-opening mines
MINE SITE STUDY OF SMOKE EXHAUSTING AUXILIARY FAN SYSTEM
Description of experiment site
Analysis scenarios
Experimental and CFD analysis methods
NUMERICAL AND EXPERIMENTAL RESULTS
Scenario I
Scenario II
Scenario III
CONCLUSIONS
INTRODUCTION
In local underground limestone mines, various types of diesel equipment are employed mainly for drilling, loading and hauling at the blind entry development sites, and the ambient air quality deteriorates fast as the blind opening is driven longer. Heavy deployment of diesel units also enhances the risk of equipment fire. Even though fires on diesel-powered equipment were reported to arise mainly from leaking high-pressure hydraulic lines which can spray a heated mist of highly combustible liquid onto an ignition source, such as a hot exhaust manifold or turbocharger (Brickel, 1987), frequent passage of heavy haulage trucks on the steep rampways at local mines creates serious concern for the truck fire by rollovers. Another prominent problem found at the blind entry development sites is one associated with the blast gases which are not only hazardous for the workers but also lead to the subsequent loss of production time. Particularly in the long blind-type development entries, the production loss time is even more serious, and many efforts have been exerted to reduce the production time loss. After few seconds of the blasting, almost the entire working spaces are likely to be occupied by the toxic gases, and it may take several hours, even days in some cases, to exhaust the contaminated air and reduce the gas levels below threshold limit value. In most of the local non-mental mines, the blasting is carried out at the end of the working shift, and the reentry is prohibited until the following shift. As a result, the rapid exhaust of the blast gases from the working space is required to assure the safe environment for the workers and also to minimize the production loss time.
In this paper, a 37 kW fan (hereafter referred to as the smoke control fan) similar to the fire smoke exhaust fan used in the vehicle tunnel was developed for exhausting the blasting gases and dense smoke in case of fire and it was applied to a blind entry development site at a local limestone mine to evaluate its efficiency. A series of scenarios were developed for the evaluation by varying the fan installation location and fan operating mode. In addition, CFD analysis was also carried out for comparison purposes. These results of this study can be applied to designing the evacuation strategy in case of the mine fire and blasting operation. The ultimate goal of this study is to optimize the smoke control fan operation mode and installation location to effectively remove or dilute airborne contaminants by blasting operation for minimizing the production loss time as well as dense smoke in case of fire.
SMOKE CONTROL FAN DEVELOPMENT FOR LARGE - OPENING MINES
Necessity of a smoke control fan in large-opening mines
Due to the increasing number of diesel equipment, concerns are raised about diesel-engine fire risk at working places. According to a report published by New South Wales Mine Safety, mobile plant fires accounted for 76 percent of mechanical plant fires in New South Wales underground mines between 2008 and 2012. GRAMKO (2005), De Rosa (2004), and Thyer (2002) have investigated the development of a fire and explosion risk assessment for underground mines. They found that the most common fire cause in underground mines is oil leakage, followed by electrical shorting/arcing and hot works. In case of fire in the underground, the safe evacuation route should be maintained within acceptable levels in terms of temperature, dense smoke, and concentration of toxic gases (Lee and Nguyen, 2016). To prevent the back-layering of fire smoke and to secure the safe space for evacuation, particularly in the large-opening mines, the best practice to control fire is to extract the smoke at the fire location by keeping the stratified smoke layer intact and securing breathable air suitable for evacuation underneath the smoke layer. This is reason the smoke control fan was developed to exhaust the blasting gases and also to control the fire smoke in large-opening mines.
It is often impractical to supply the sufficient fresh air to dilute the pollutants air at deep blind working sites with the current conventional ventilation method including the auxiliary fan with tubing. In this case, a free-standing auxiliary fan without tubing can be proposed as an alternative method. Grau et al. (2002, 2006) and Grau and Krog (2009) studied the unducted fan ventilation system and found that the correct auxiliary fan location should be outby the last open crosscut where it can entrain and blow fresh air into the face area. A number of ventilation studies by FOSTER - MILLER (1980), Goodman (1992) measured the performance of free-standing jet fans either in single headings or ventilating portions of the main airways. These studies have shown that the important role of the auxiliary fans to improve the ventilation efficiency in large-opening underground mines. Thus, the studies on the risk of diesel-engine fire in underground mines by GRAMKO (2005), De Rosa (2004), Thyer (2002), Yuan L (2004, 2006, 2007), Edwards (1999, 2006), and Zhou F (2005) are the background for the development of a smoke control fan in this study.
Description of the smoke control fan for large-opening mines
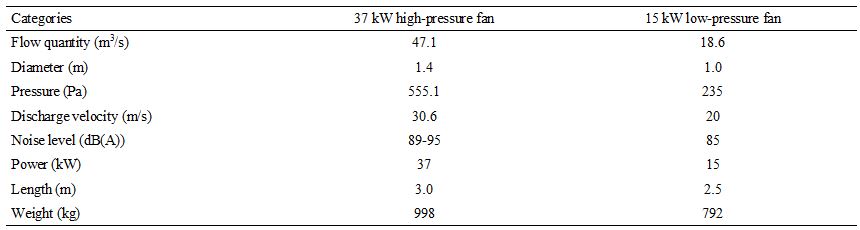
In large-opening airways, a low-pressure fan can supply a relatively large airflow due to the fact that the pressure required is proportional to the cube of cross-sectional area. Several studies at NIOSH by Grau et al. (2002), Grau et al. (2006), and Chekan et al. (2006) indicated that the low-pressure fan pressure with larger diameter provides better regional air coverage in large-opening mines than the high-pressure fan. The authors developed a 15 kW low-pressure fan suitable for the local large-opening limestone mine airways (Lee and Nguyen, 2015; Park et al., 2017). However, the low-pressure fan can hardly be used for the purpose of smoke exhaust, since its velocity profiles are relatively low in the inlet space. Fig. 1 shows the axial-flow high-pressure fan developed in this study. Its specifications in Table 1 was designed to prevent the back-layering phenomenon of the smoke in case of a 30MW fire in 10 m (W) × 8 m (H) horizontal airways.

MINE SITE STUDY OF SMOKE EXHAUSTING AUXILIARY FAN SYSTEM
Description of experiment site
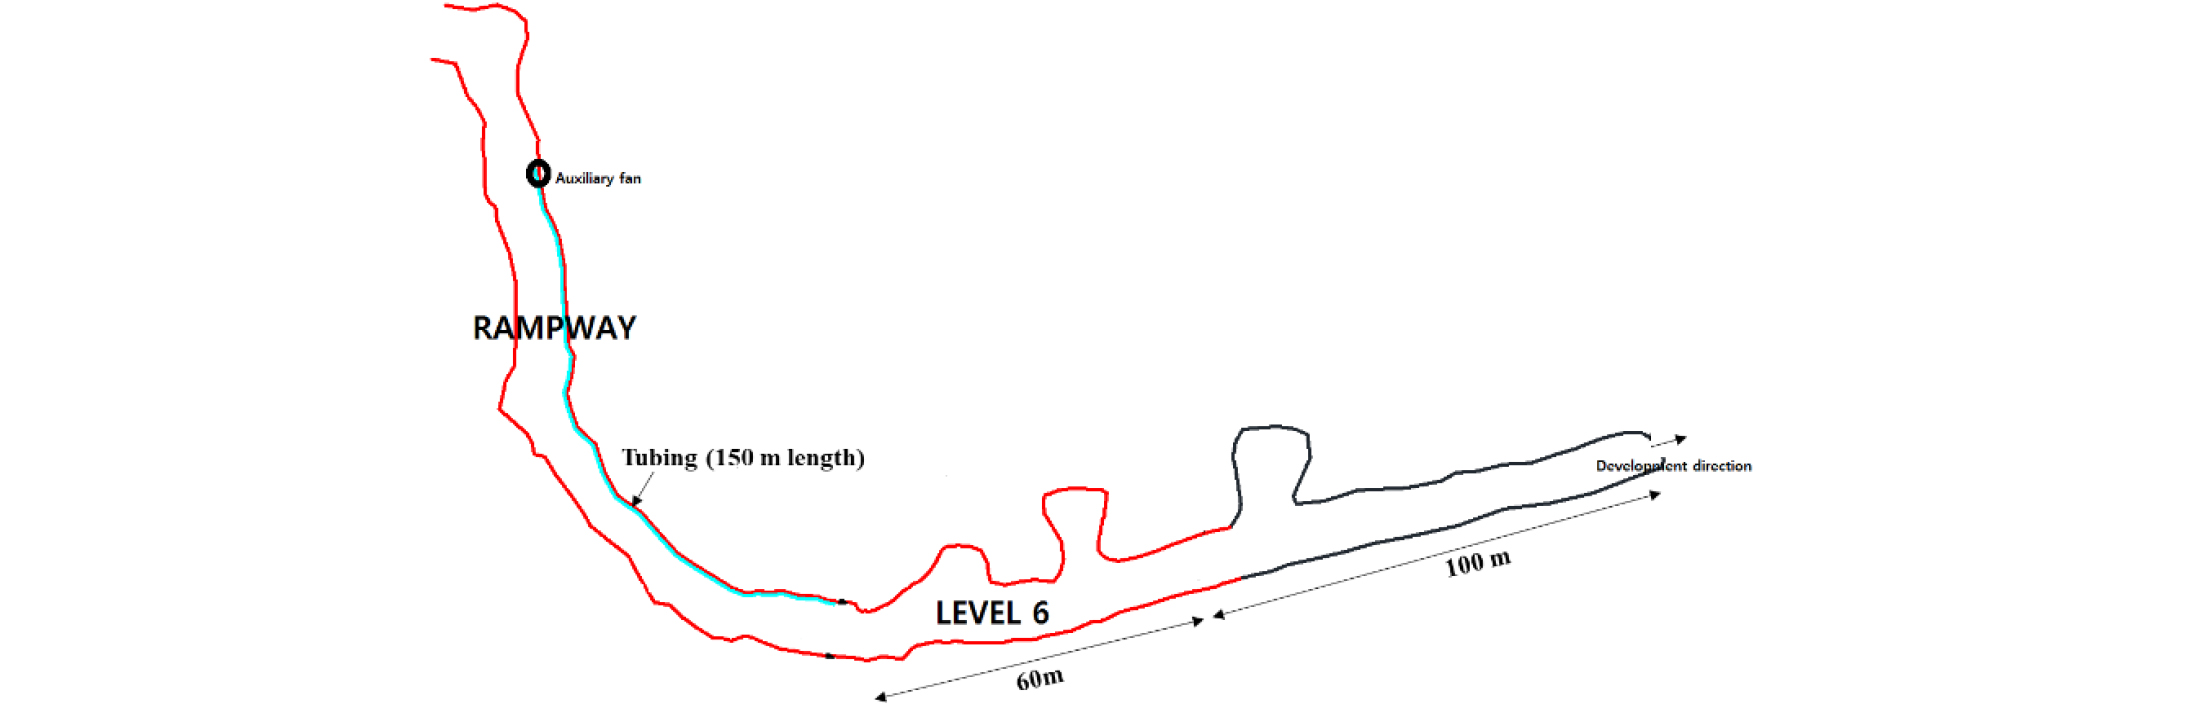
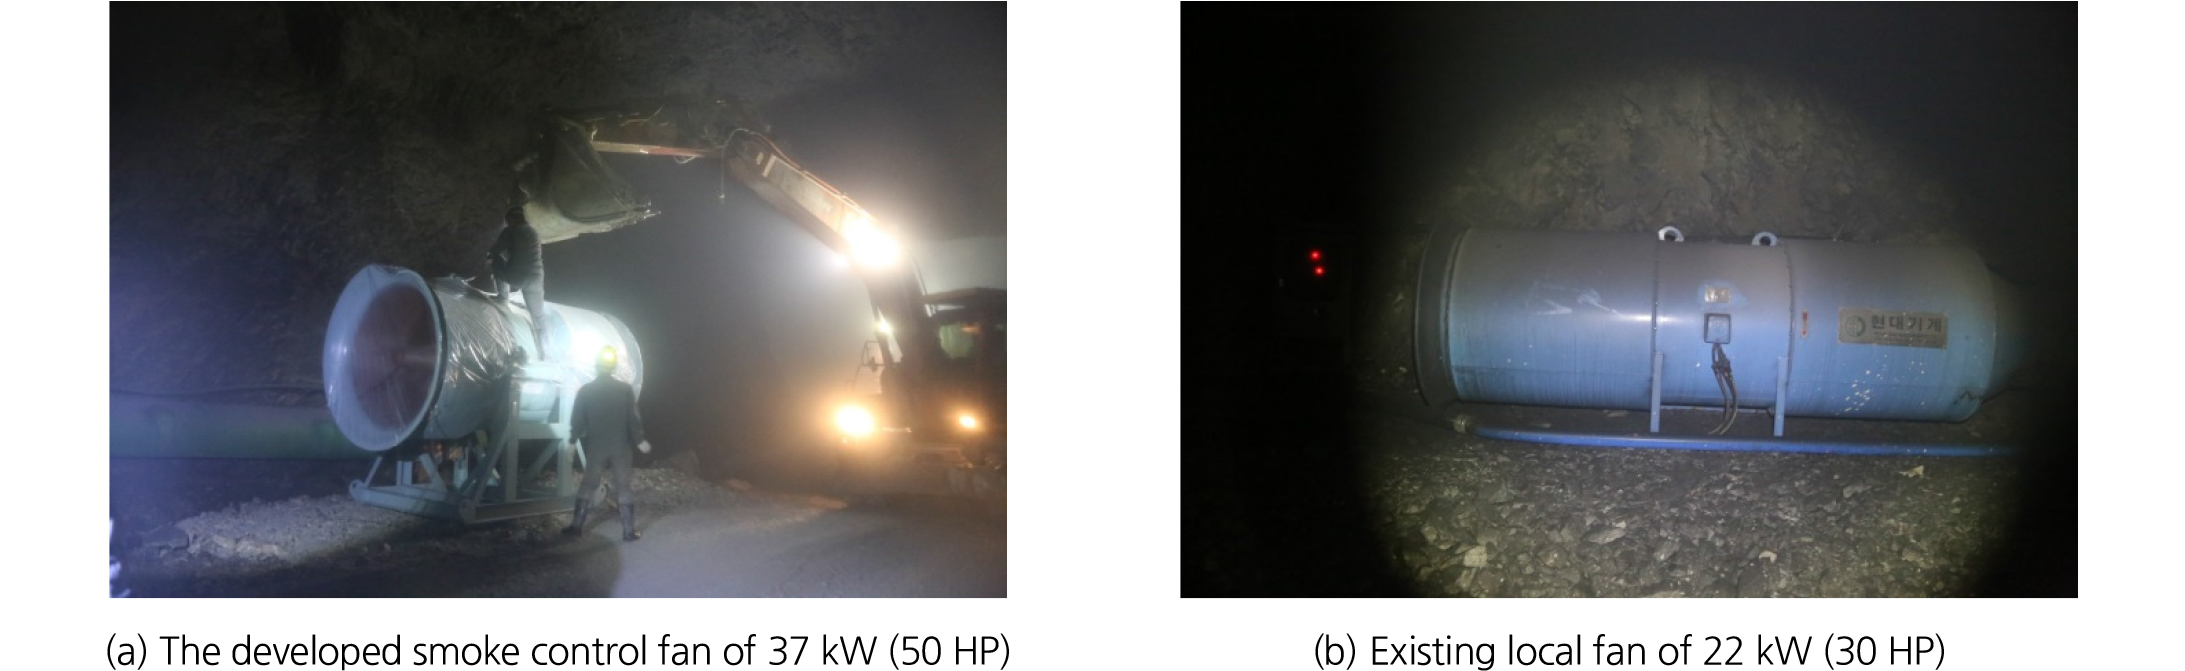
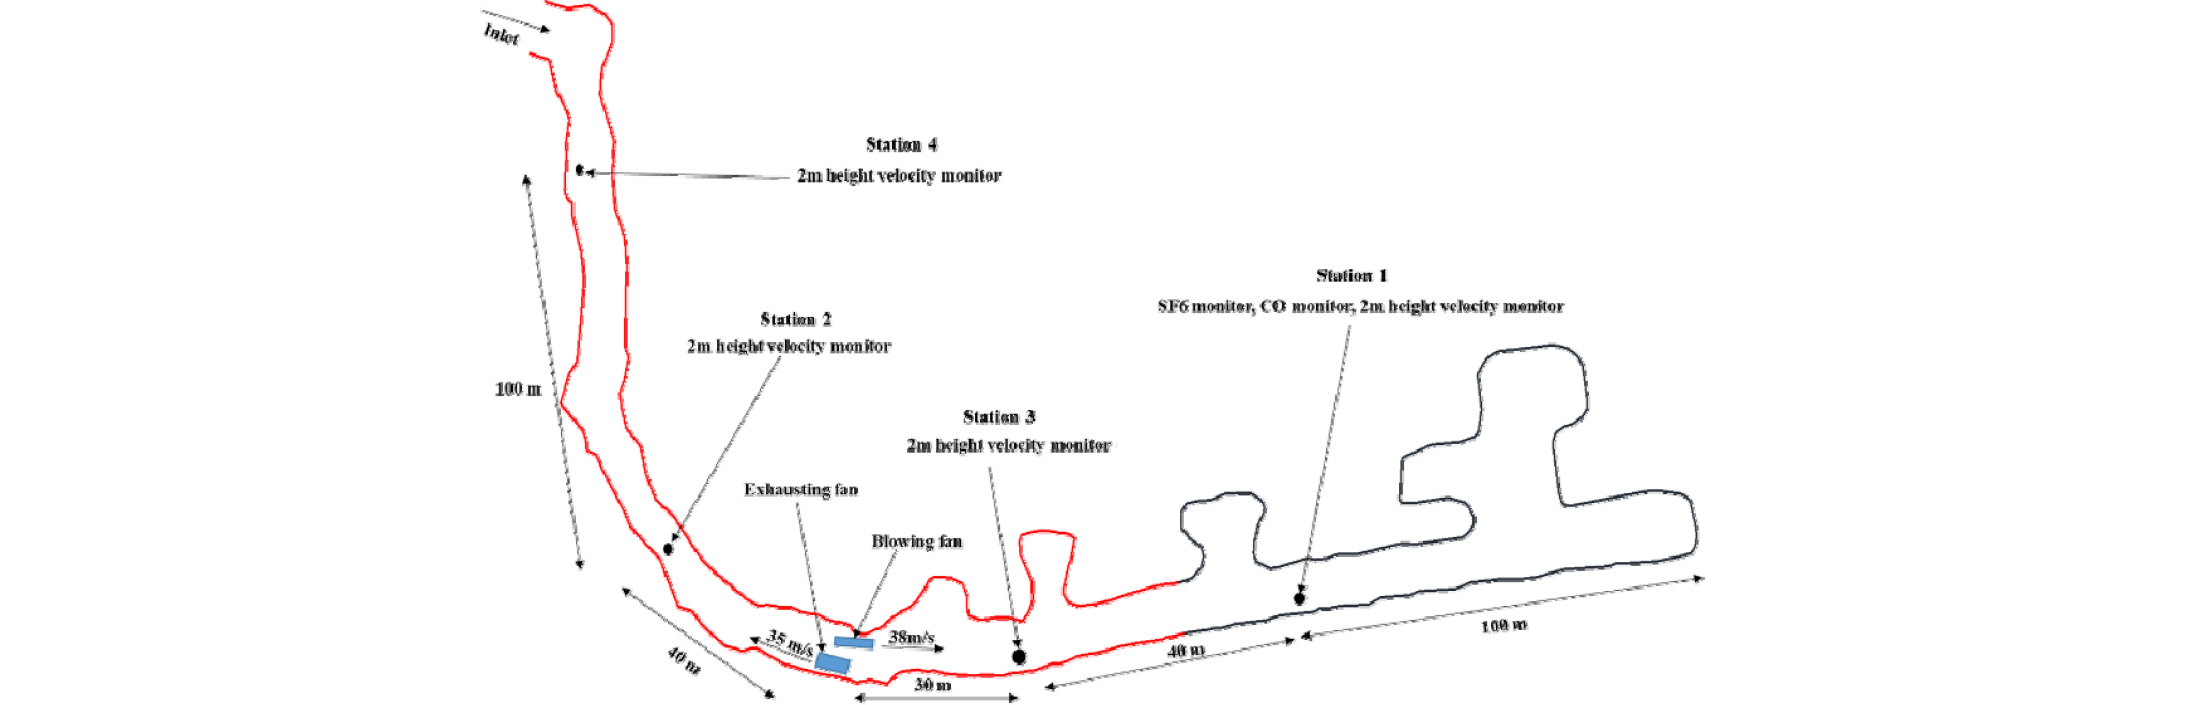
Fig. 2 shows the test site for the fan efficiency experiment. The site at D mine, Chungbuk Province, was one of the blind entry development sites connected to a rampway of 9% grade. The entry was 10 m (W) × 8 m (H) and the entry length driven at the time of the experiment was about 160 m. A 22 kW auxiliary fan (hereafter referred to as the site fan) was on the rampway for the face ventilation and 20 m3/s of the air was blown into the entry through the 150 m-long Φ 600 mm flexible canvas duct. The discharge velocity at the end of the duct was approximately 10 m/s. The smoke control fan and the auxiliary fan operated at the site were used for evaluating the smoke exhaust efficiency. Fig. 3 shows the pictures of two fans images used in this study.
Analysis scenarios
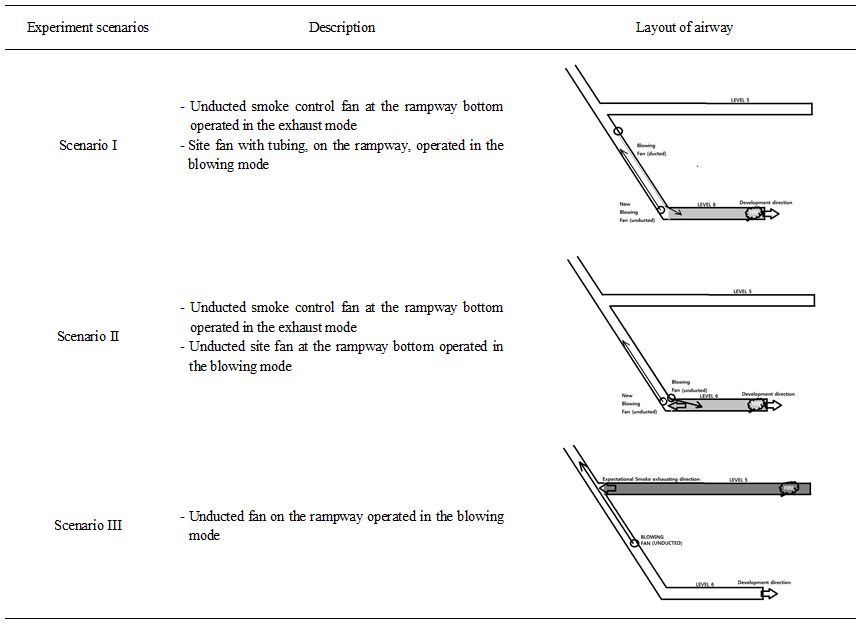
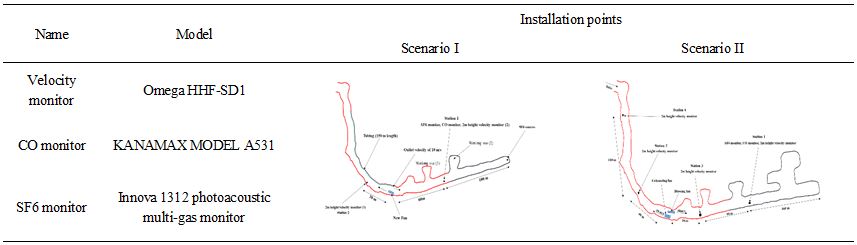
As described in Table 2, three scenarios were designed to evaluate the smoke exhaust efficiency of the smoke control fan. Those scenarios are different with respect to the fan installation location and operating mode. In Scenario I and II, the smoke control fan was operated along with the 22 kW site fan. In Scenario I, the smoke control fan was installed at the bottom of the rampway and it was operated in the exhaust mode without tubing, while the ducted site fan was run in the blowing mode as it was. The tubing tip was pushed about 3 m closer to the face compared to the unducted smoke control fan discharge plane. Scenario I aims at having the smoke or pollutants dispersed in the working face by the site fan and exhausting them with the smoke control fan. Meanwhile, in Scenario II, the tubing was removed from site fan and the fan was moved to the location where the tubing tip was placed. This was planned to increase the turbulent intensity in the working space and then make the exhaust easier with less exhaust velocity profile. Scenario III shows a completely different situation where the smoke fan is installed outside the blind entry and is used to create a high-velocity pressure and subsequently a relatively low static pressure at the entry entrance. This will generate the outward transport of the smoke from the entry due to the difference in the static pressure between the inner part of entry and the entry entrance. This phenomenon, so-called “venturi effect” was evaluated in Scenario III, only by the CFD analysis.
Experimental and CFD analysis methods
After having installed the two fans as planned in Scenario I and II, those were turned on at the same time during the normal drilling operation by a diesel-powered drilling machine. Then, a known amount of SF6 gas was injected into the working face to evaluate the changes in the airflow as well as the pollutants transport behavior by fan operation.
During the fan operation, the fan performance was analyzed by monitoring the airflow and gas concentrations in the blind development entry at fixed locations using hot wire anemometers, and SF6 and CO gas monitors as shown in Table 3.
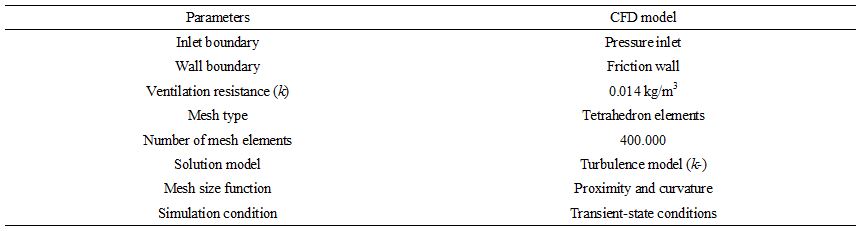
Applications of the CFD technique in the underground mine environment can be found in numerous studies at home and abroad. ANSYS-FLUENT has commonly been used by many researchers to study various fluid-flow and heat transfer problems in underground ventilation engineering. In this study, the CFD analysis was carried out using ANSYS FLUENT which has commonly been used by many researchers to study various fluid-flow and heat transfer problems in the underground mine environment (ANSYS, Inc., 2017). The conditions for CFD analysis are summarized in Table 4. The turbulence model was employed in this CDF study.
NUMERICAL AND EXPERIMENTAL RESULTS
Scenario I
In Scenario I, both fans were used; the site fan blows the air through Φ600mm tubing into the working space and the unducted smoke control fan at the rampway bottom exhausts the polluted air. As shown in Fig. 4, they were placed on the opposite sides, and the site fan tubing tip was located slightly ahead of the exhaust fan inlet to avoid the early recirculation. SF6 gas was dispersed in the vicinity of the excavated surface, and SF6 and CO gas concentrations and velocities were monitored at Station 1, 100 m downstream of the face, and the second monitoring station, Station 2 was set up at 30m downstream of the smoke control fan.
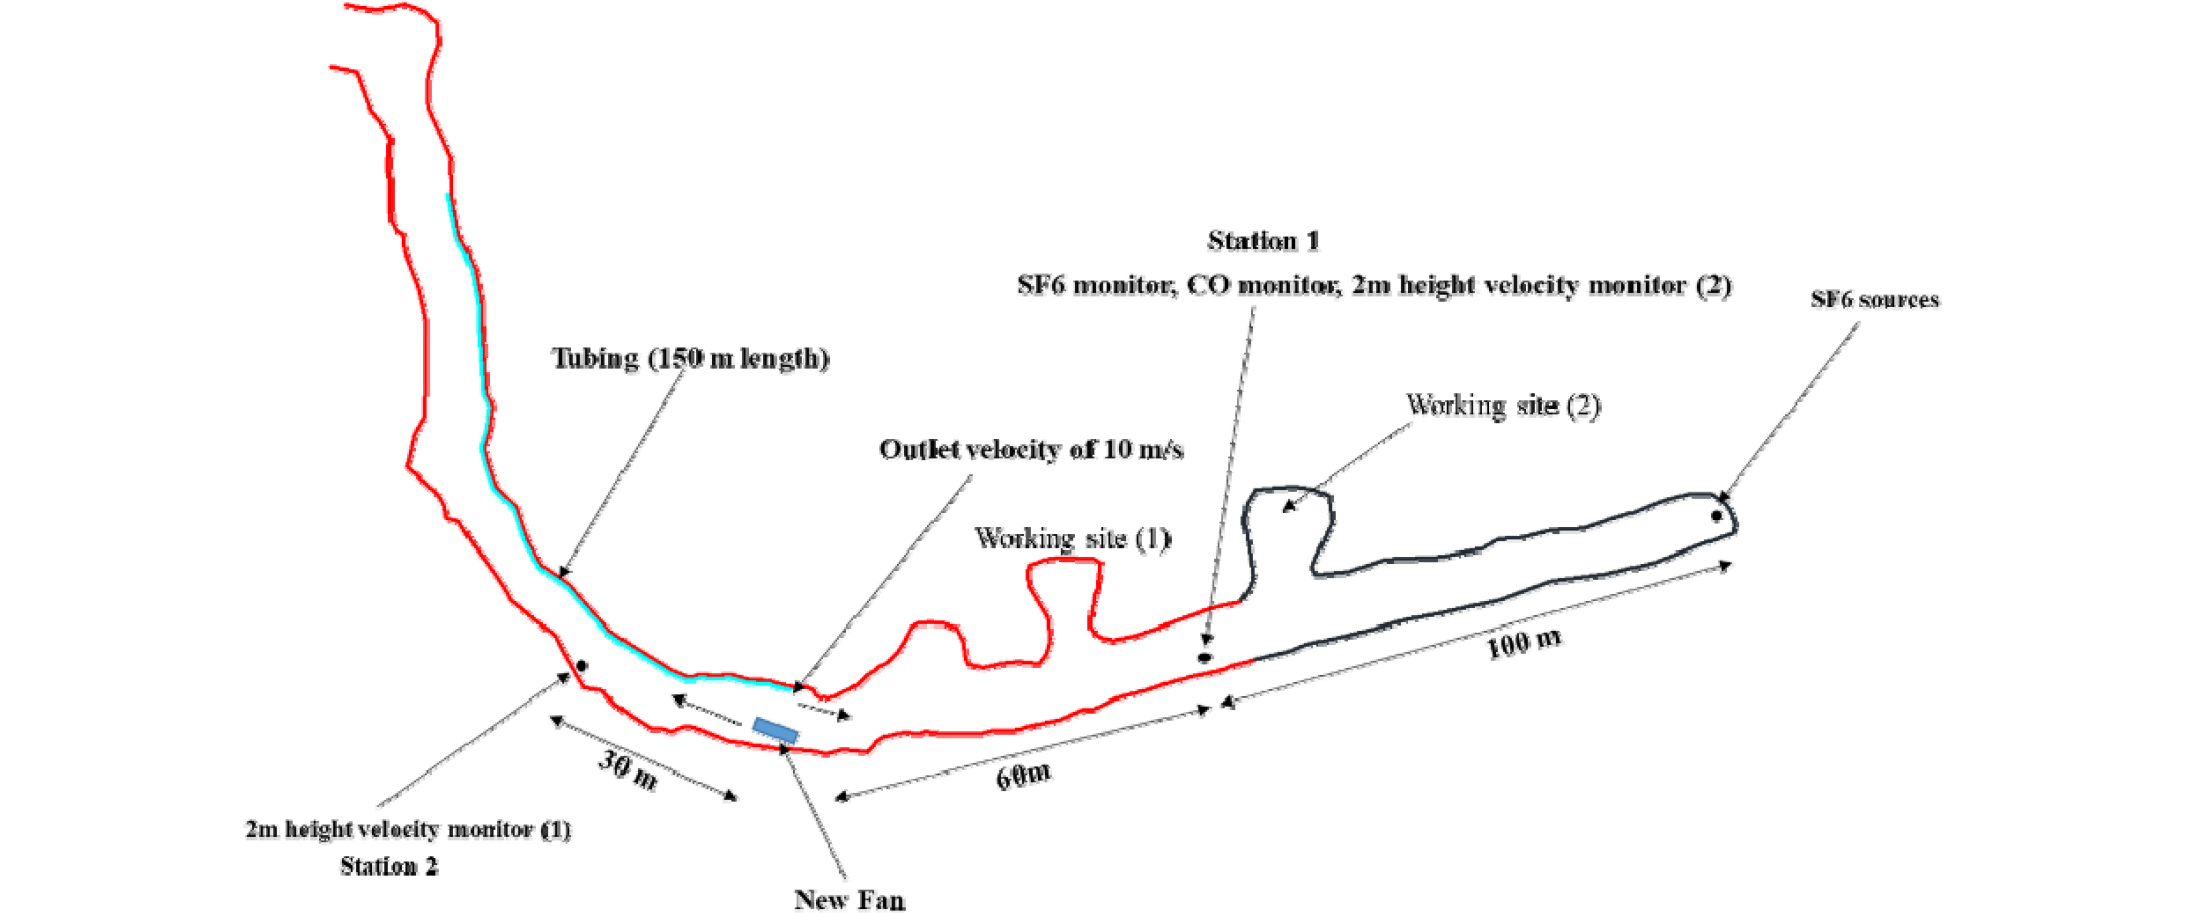
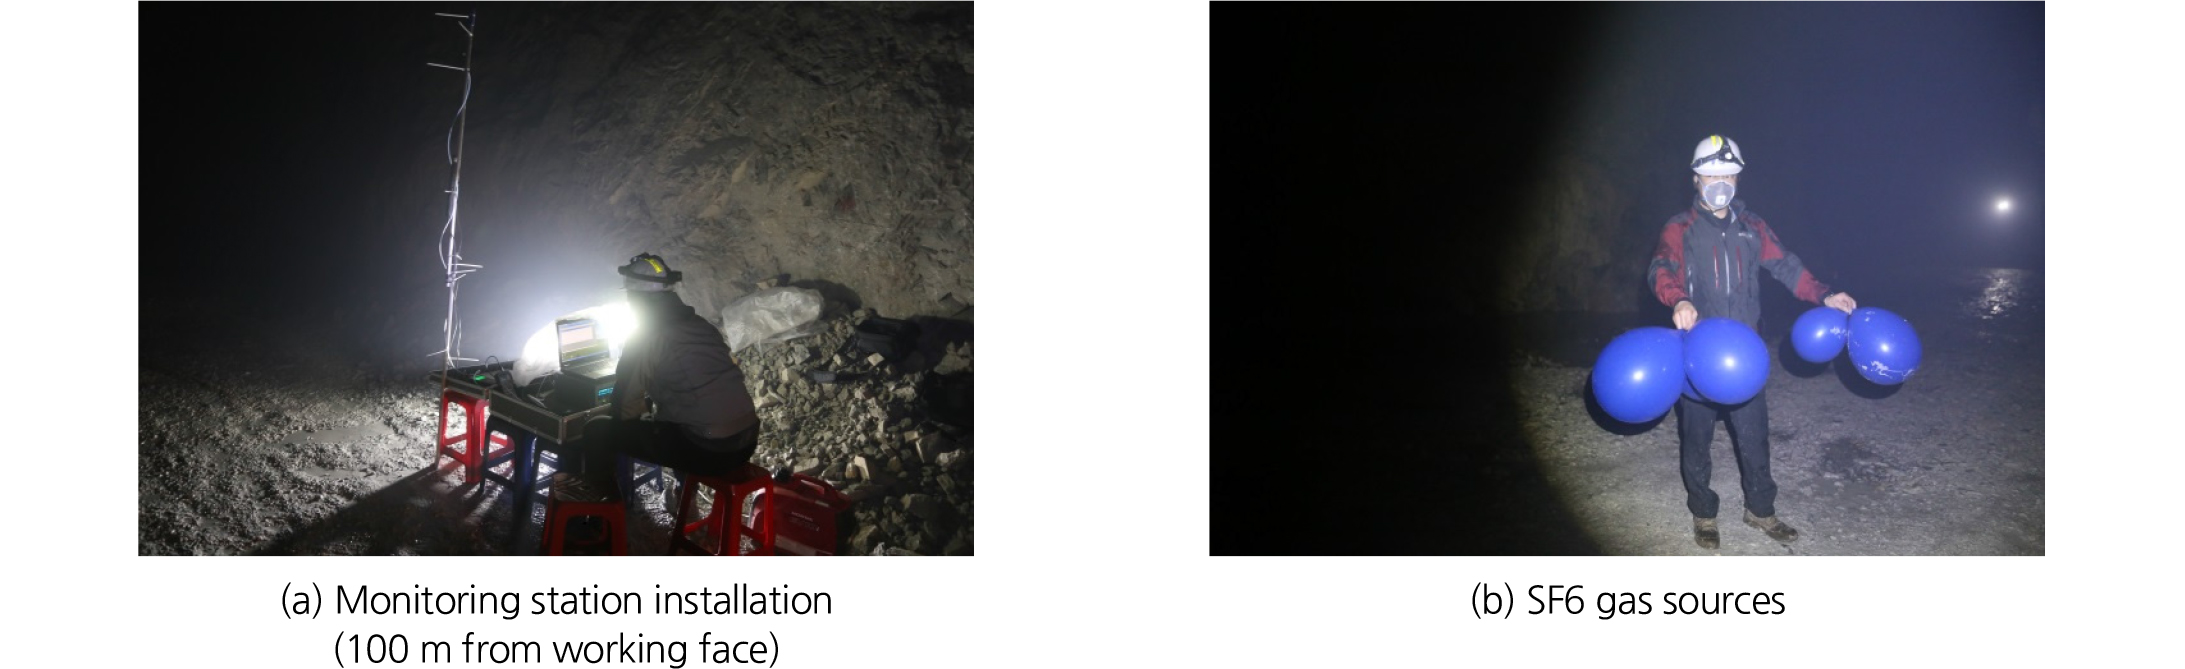
Fig. 6 shows the SF6 concentration distributions at Station 1 after dispersing 51 liters of SF6 at 12: 07:21 PM. The following statistical techniques were applied to analyze the effect of fan operation on gas concentrations until the same amount was secondarily diffused at 12:49:00. The temporal changes in the substance concentration in the downstream direction ( ) is governed by the ventilation rate (u), the spatial concentration gradient (
 ), and the turbulent diffusion coefficient (D), as described in Fick’s law of diffusion.
 (1)
(1)
As in the law, the effect of turbulent diffusion is a critical variable in the limestone mine, where most of the places show the extremely low velocity of less than 0.1 m/s, immeasurable by the vane-type anemometer.
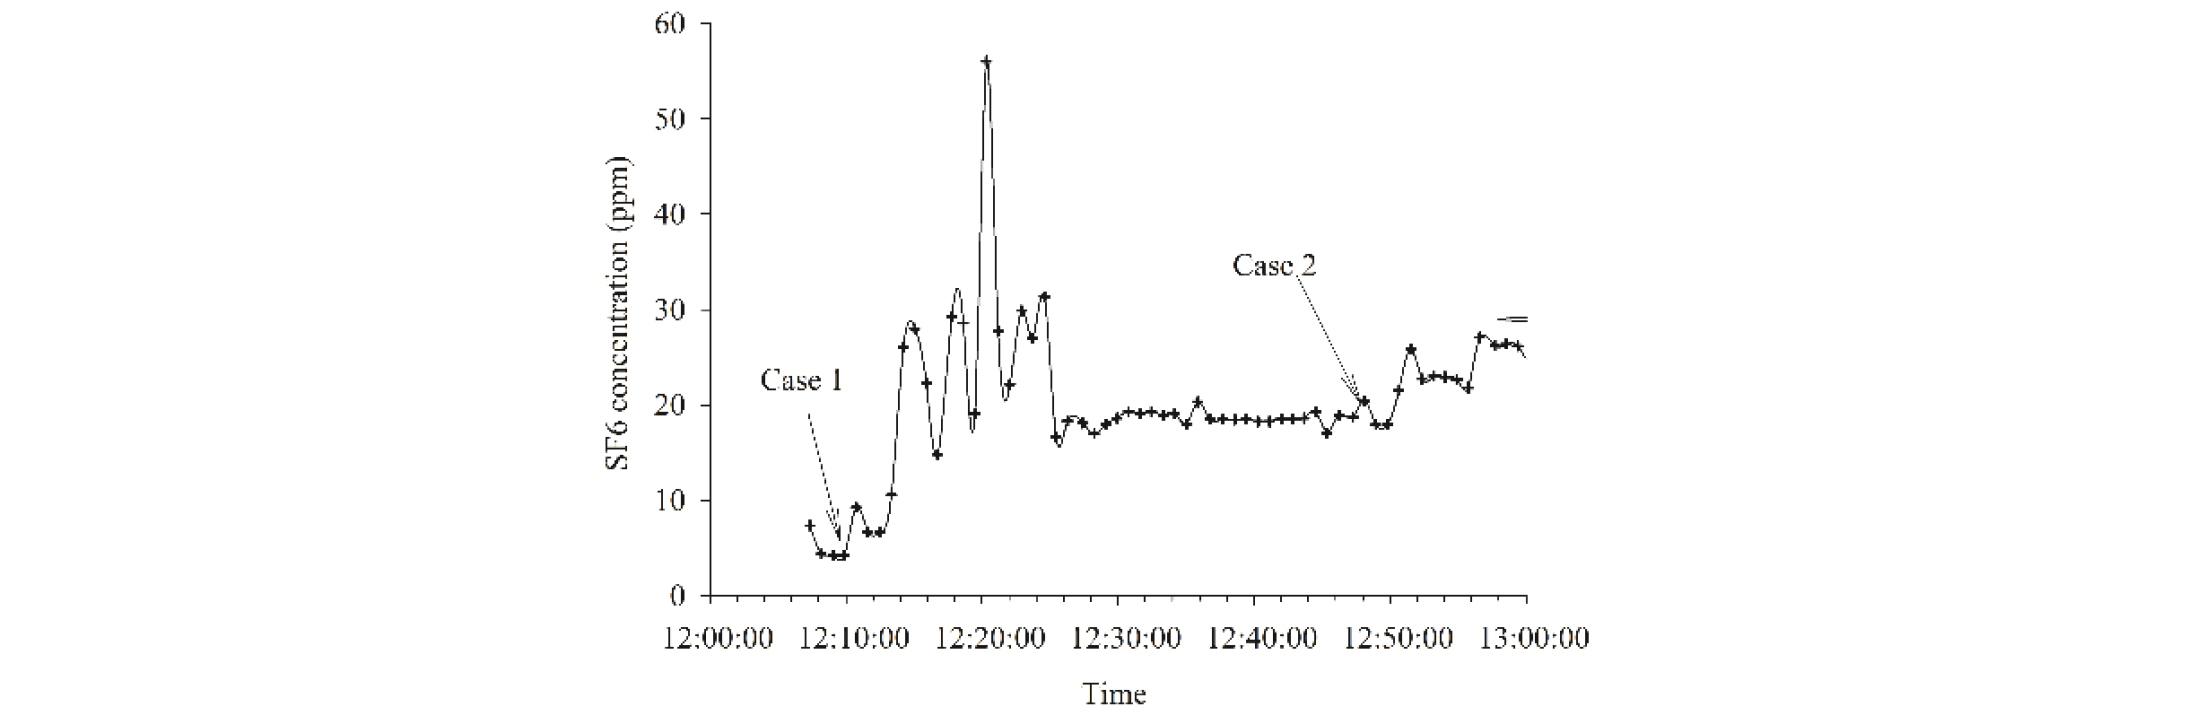
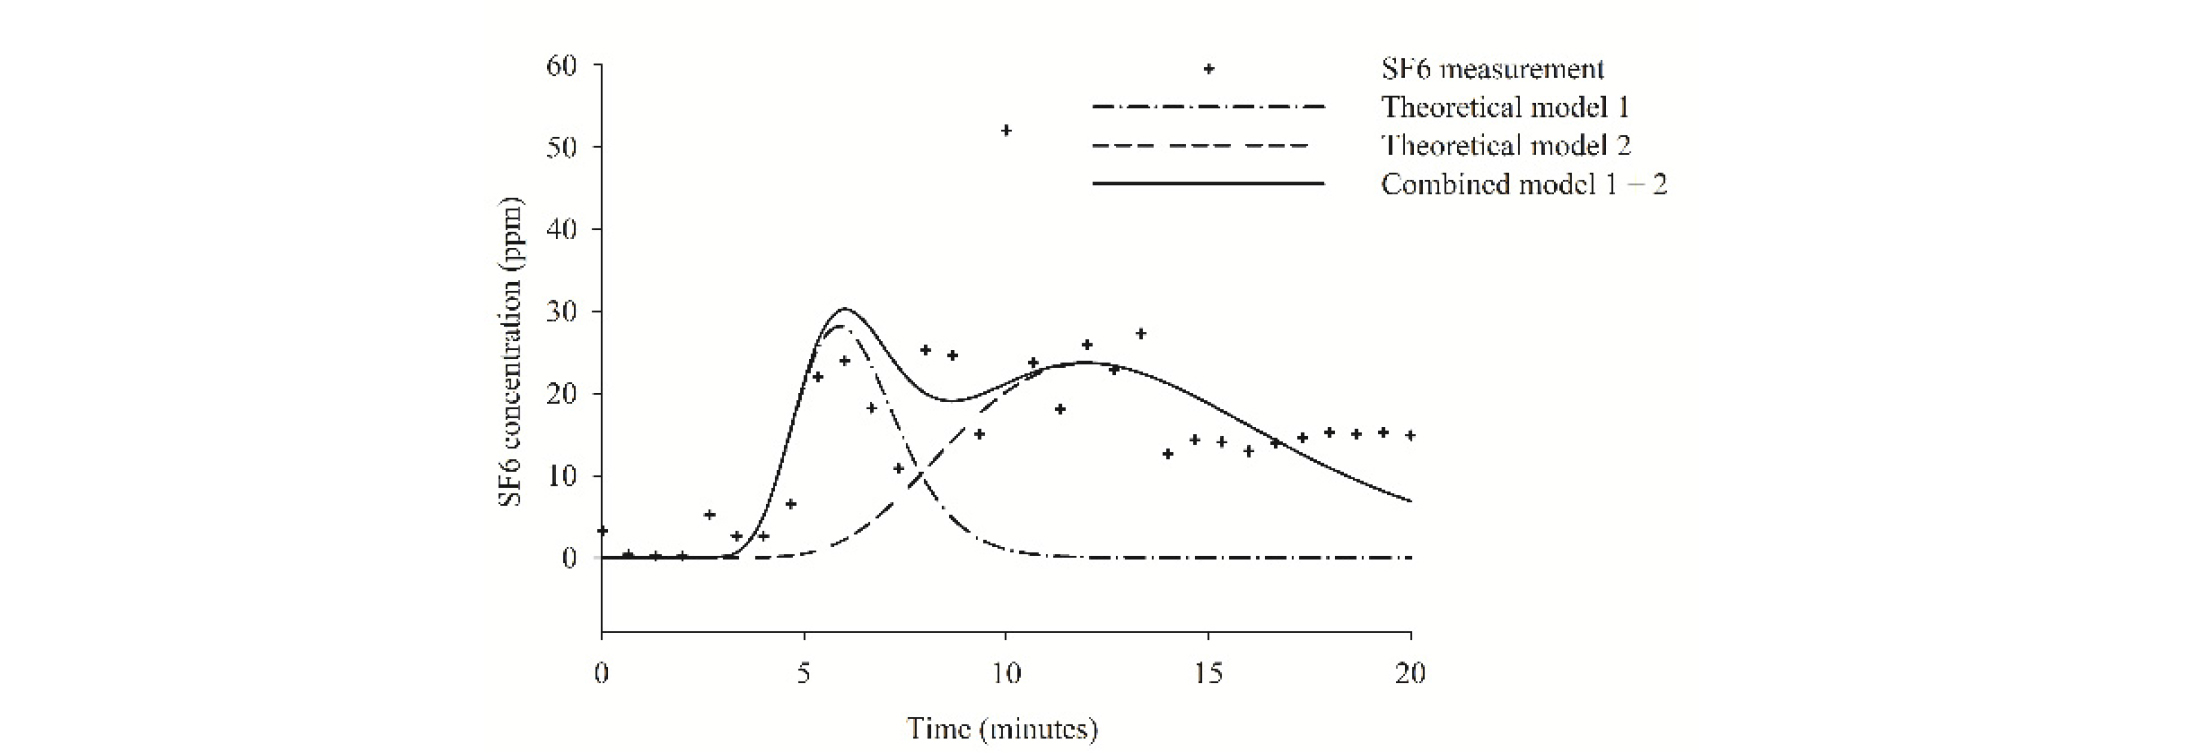
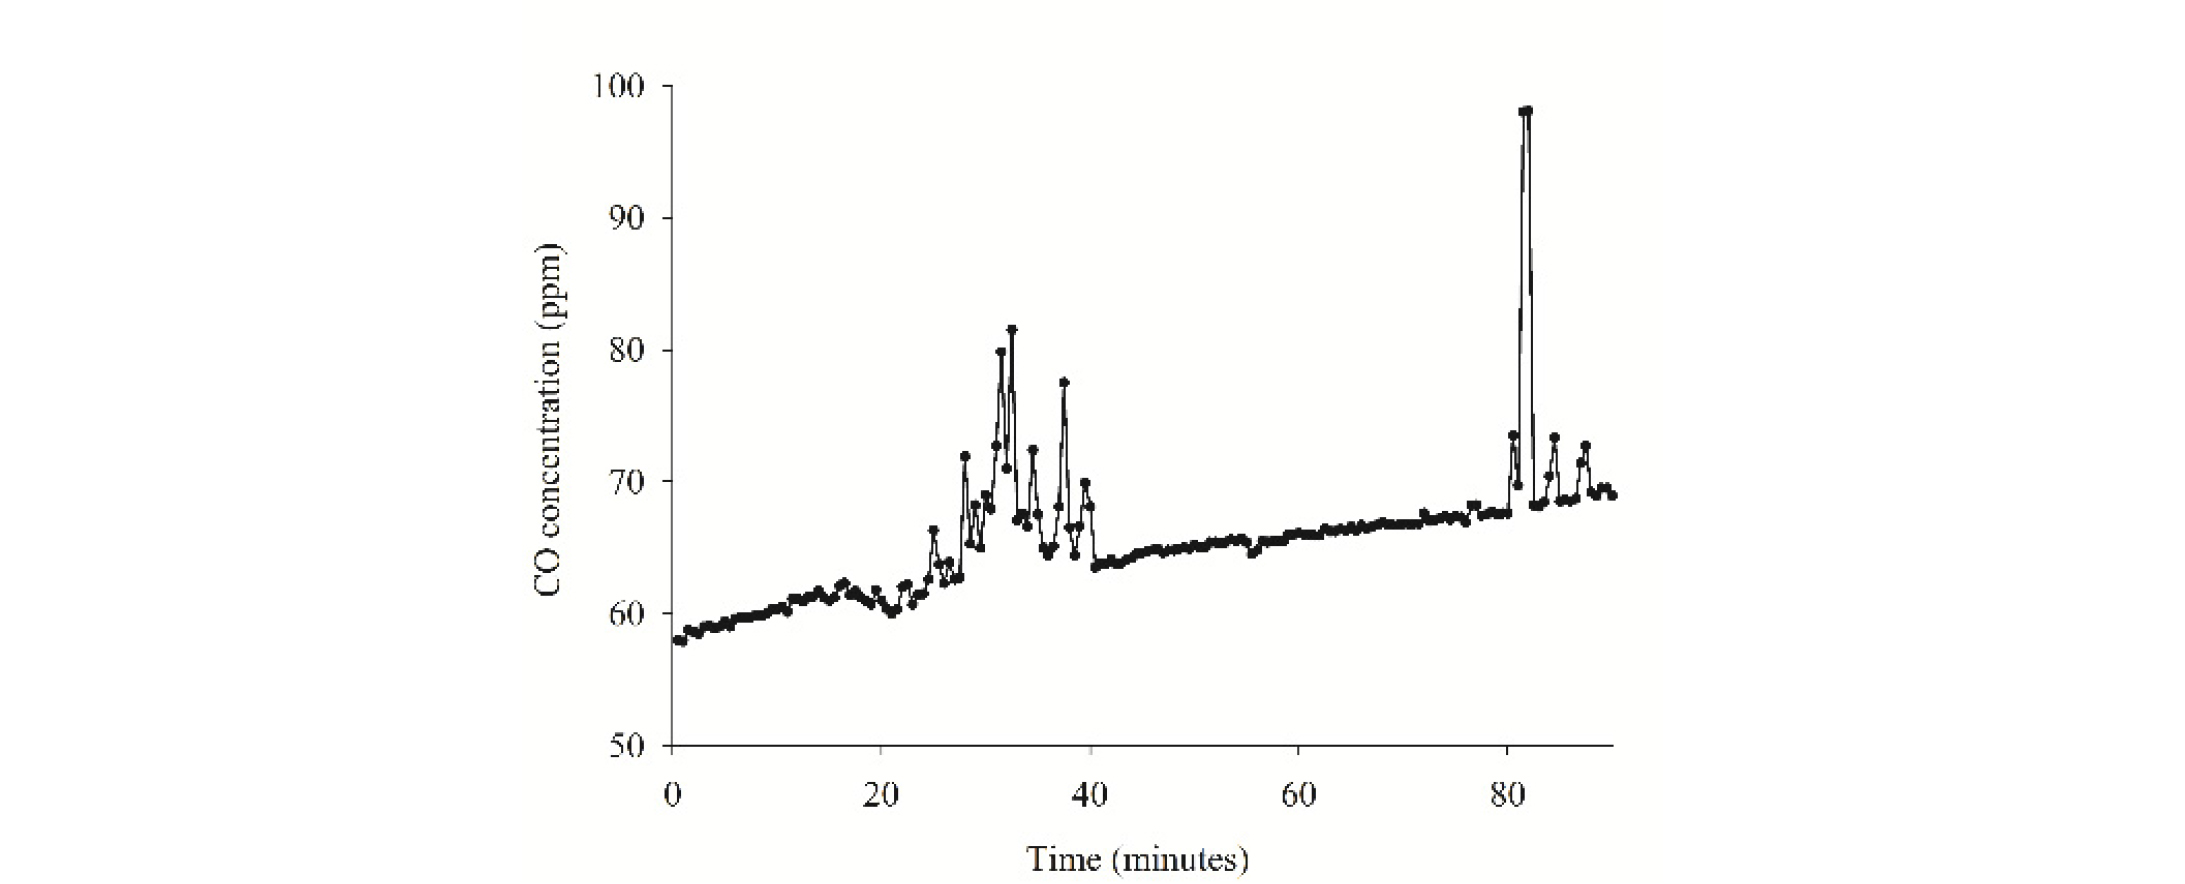
Since the SF6 gas at the experimental site diffused by the separate airflows created by the two fans, the first phase of the concentration profiles in Fig. 6 originated from the first SF6 dispersion can be divided into the two individual concentration profiles governed by the Fick’s law. Excluding several outliers, the goodness of the fitting by two turbulent diffusion models is found to be high as plotted in Fig. 7. The amount of SF6 transported by both modes in Fig. 7 accounts for only 51% of the total amount dispersed. This indicates that a considerable amount of SF6 was recirculated within the working entry. This recirculation phenomenon can be clearly observed in Fig. 8 which shows the gradually increasing CO concentration even with the two-fan operation.
Due to the poor maintenance of tubing, significant amount of leakage was observed and this made the tubing discharge velocity reduced to no more than 10 m/s. Fig. 9 shows the air velocity distributions measured at Station 1 and 2. During the fan operation, the velocities were kept constant with the average of 2.5 m/s at Station 2, 30 m downstream of the smoke control fan and 0.3 m/s at Station 1, 100 m upstream.
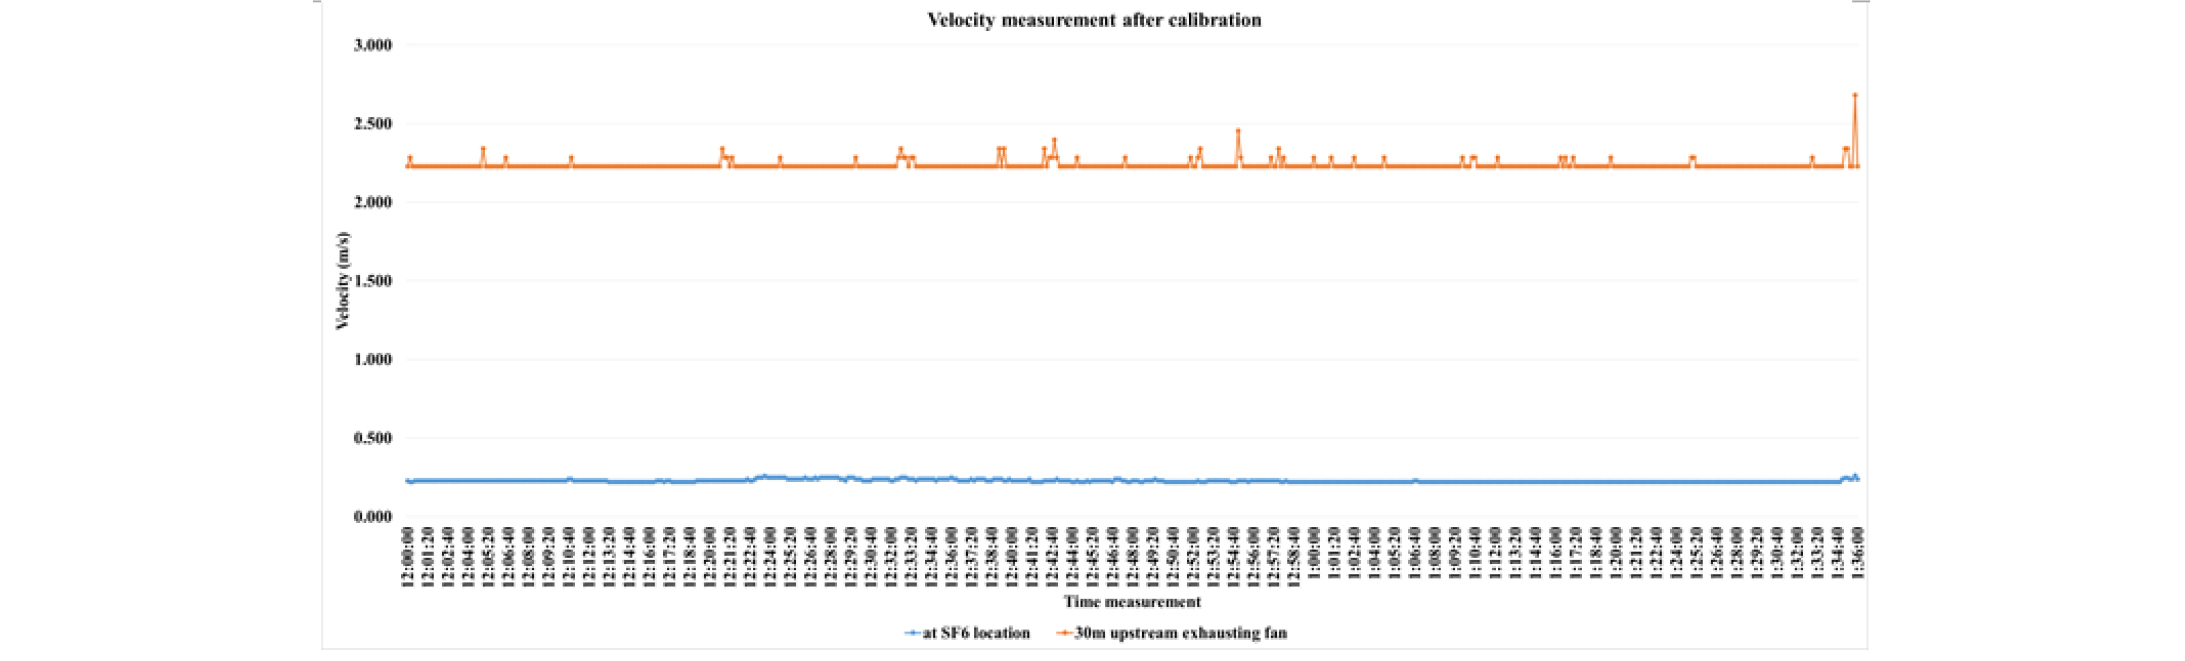
Fig. 10 is the CFD model for Scenario I and Fig. 11 shows the results of the estimated distribution of U-velocity at the 1m-high plane. It is clearly seen that the jet stream discharged upward toward the rampway from the exhausting smoke control fan might lose most of its momentum when collided with the rampway wall. After the collision, the air was sucked into the site fan and discharged through the tubing into the working space. This observation of considerable recirculation can also be proved by the CO concentration profiles over the test site with a CO source of 0.2 kg/s at the face. The source strength is equivalent to the CO emission rate of a heavy truck.
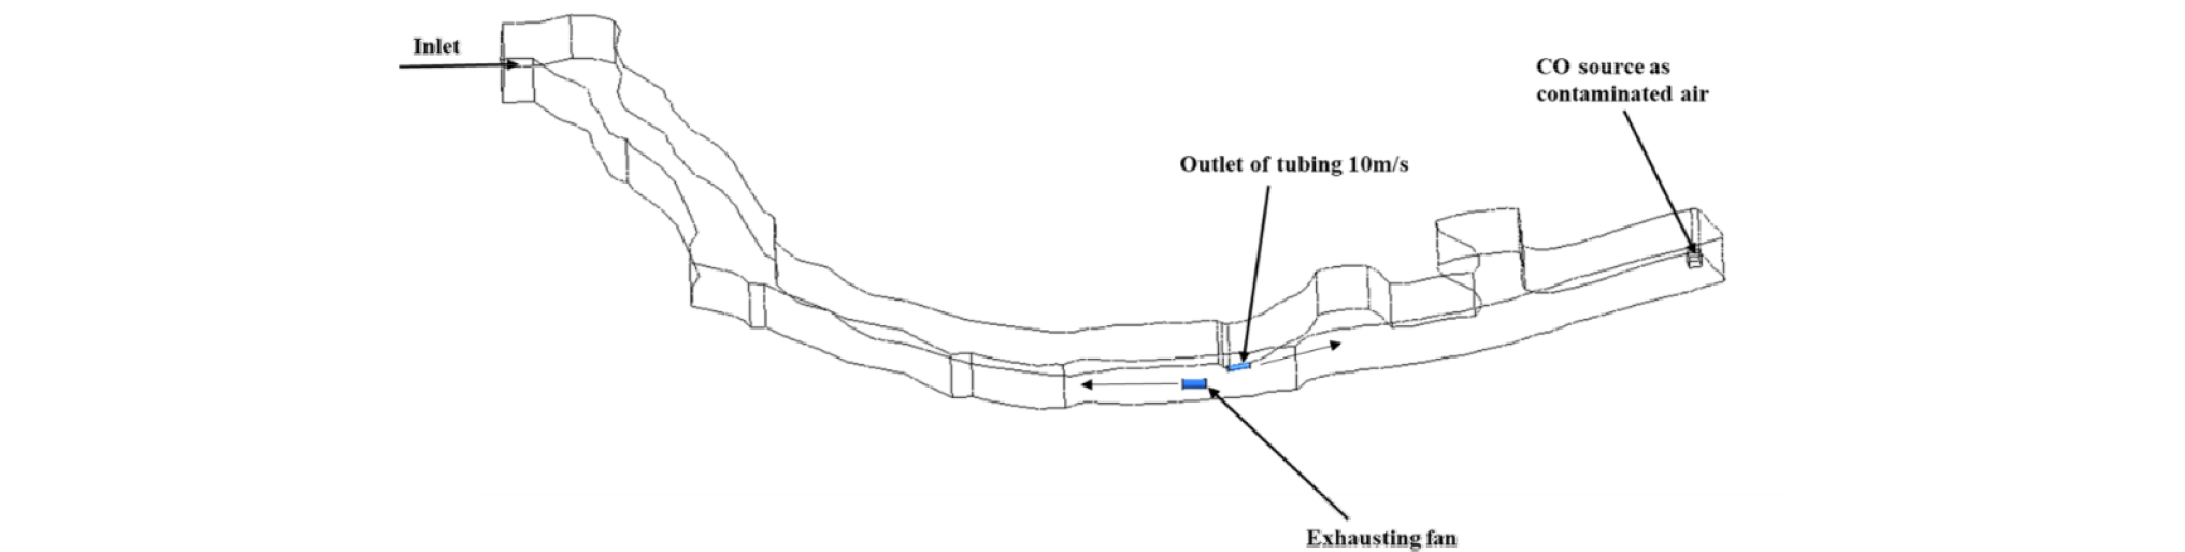

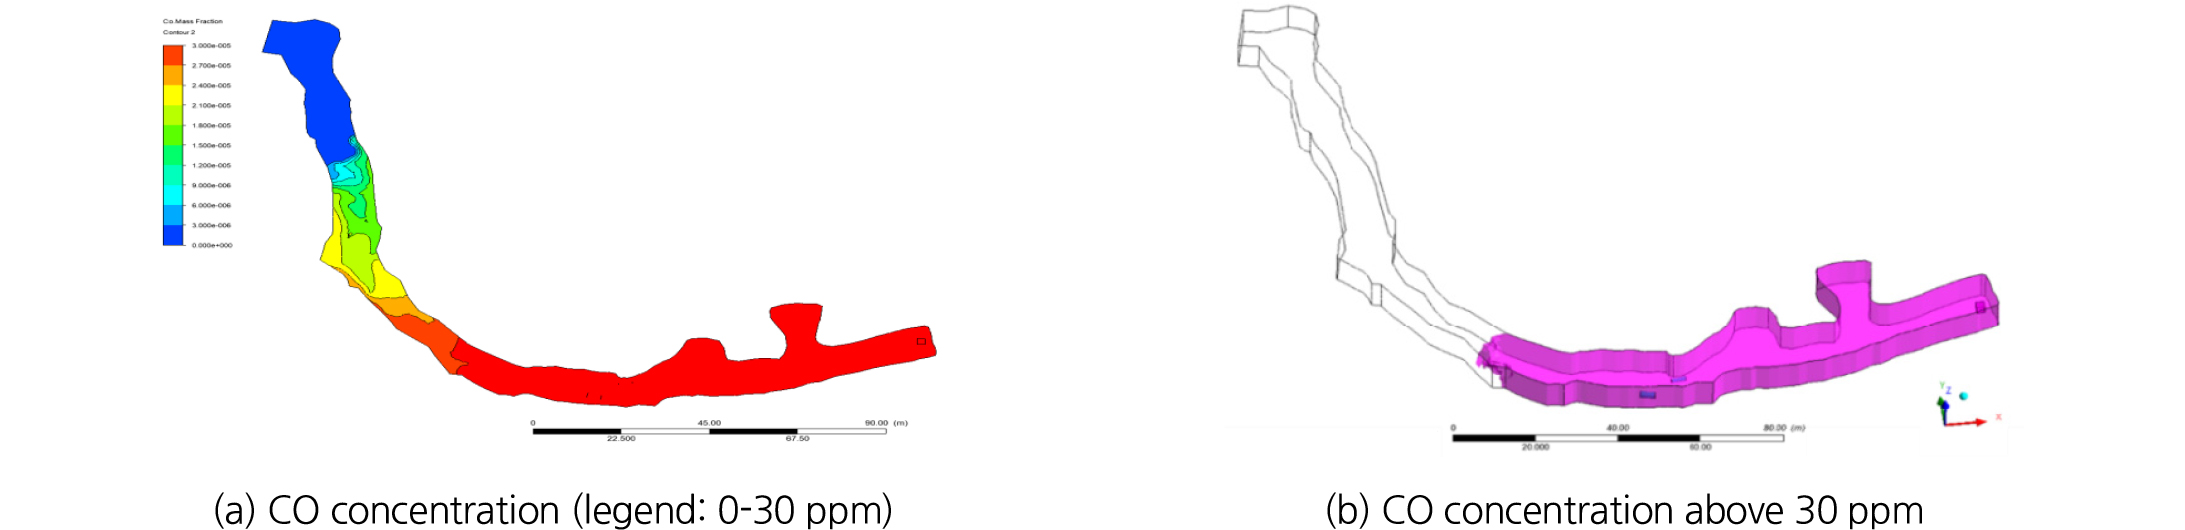
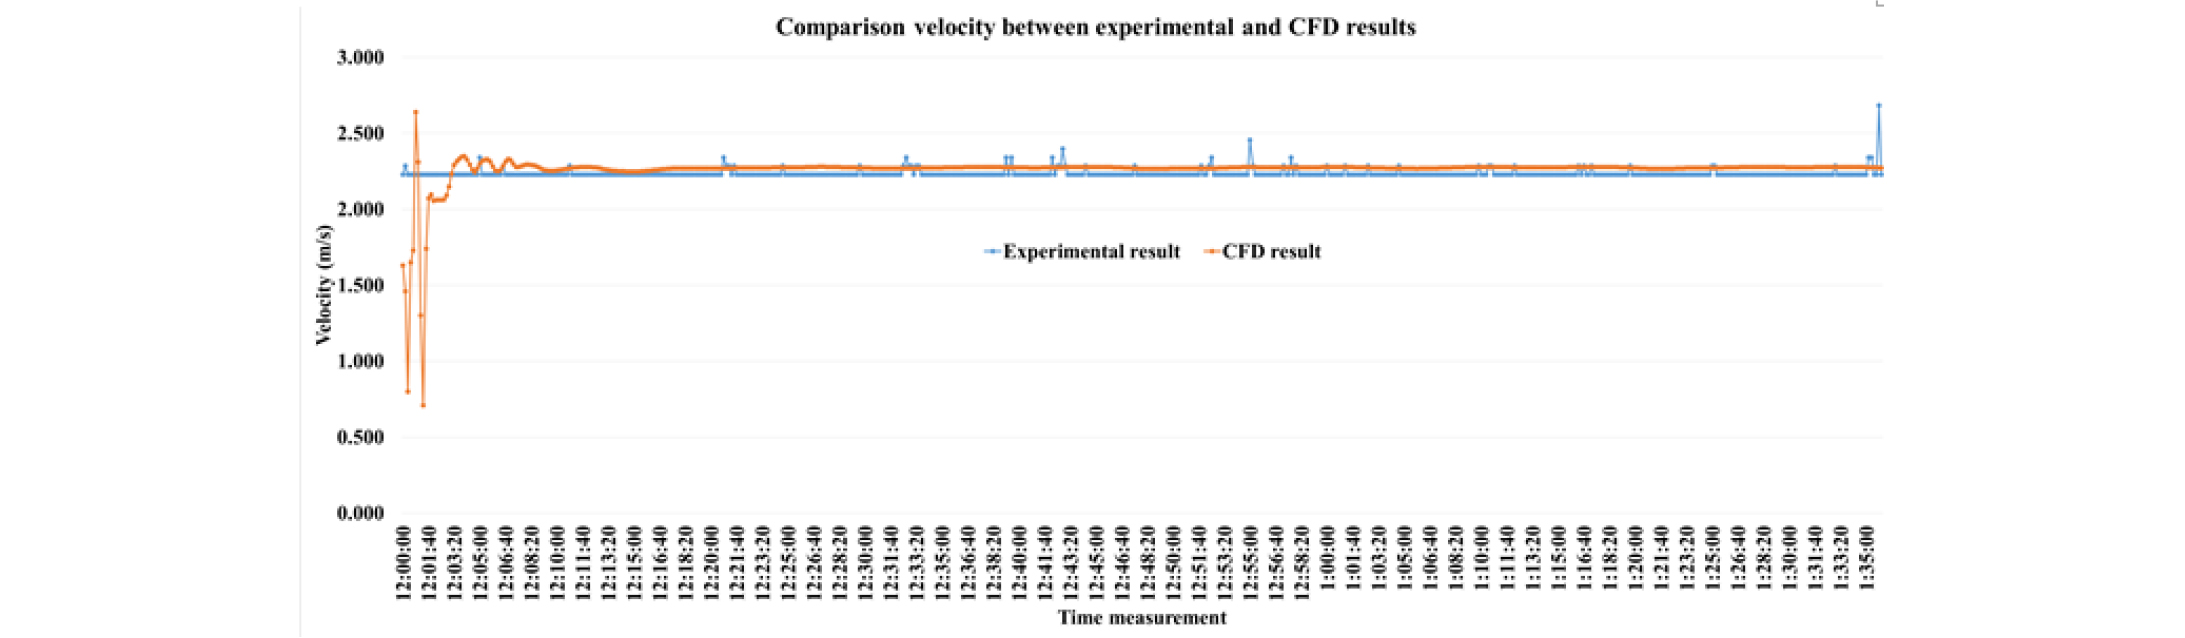
Fig. 12 shows the CO concentration profiles even after the simulation time of 2.5 hours. Due to the air recirculation as shown in Fig. 11, the CO concentrations are found to be 32-65 ppm in almost all locations in the 130 m-long blind entry and this indicates that CO accumulated in the working space is not exhausted through the rampway by two fans installed and operated as in Scenario I. In Fig. 13, the velocity measurements at Station 2 by CFD are compared with the experimental measurements and the CFD analysis seems to fit the experiment data very well.
Scenario II
As in Scenario I, both fans were applied. Based on the observations made in Scenario I, the position of the smoke control fan was slightly changed to prevent early collision of the jet stream with the rampway wall. The 150 m-long tubing was removed and then the site fan was relocated right next to the smoke control fan to increase the turbulence intensity in the working space with faster moving jet streams. The main reason for the site fan relocation was due to the low discharge velocity and the velocity measured at the unducted site fan outlet was found to be 38 m/s. Fig. 14 shows the layout of Scenario II, which indicates the entry developed further compared with Scenario I. As the development entry length increased, monitoring stations were added; one 30 m upstream the smoke control fan (Station 3) and the other 140 m downstream (Station 4). All the experiments were carried out during the drilling operation and haulage trucks were also in operation.
Two fans were turned on at 13:49:00 and the same amount of SF6 as in Scenario I was injected at the face. From then on, the SF6 injection was repeated twice at 15:02:18 and 15:43:23 as shown in Fig. 15 describing the SF6 concentrations monitored at Station 1, 100 m downstream the face.
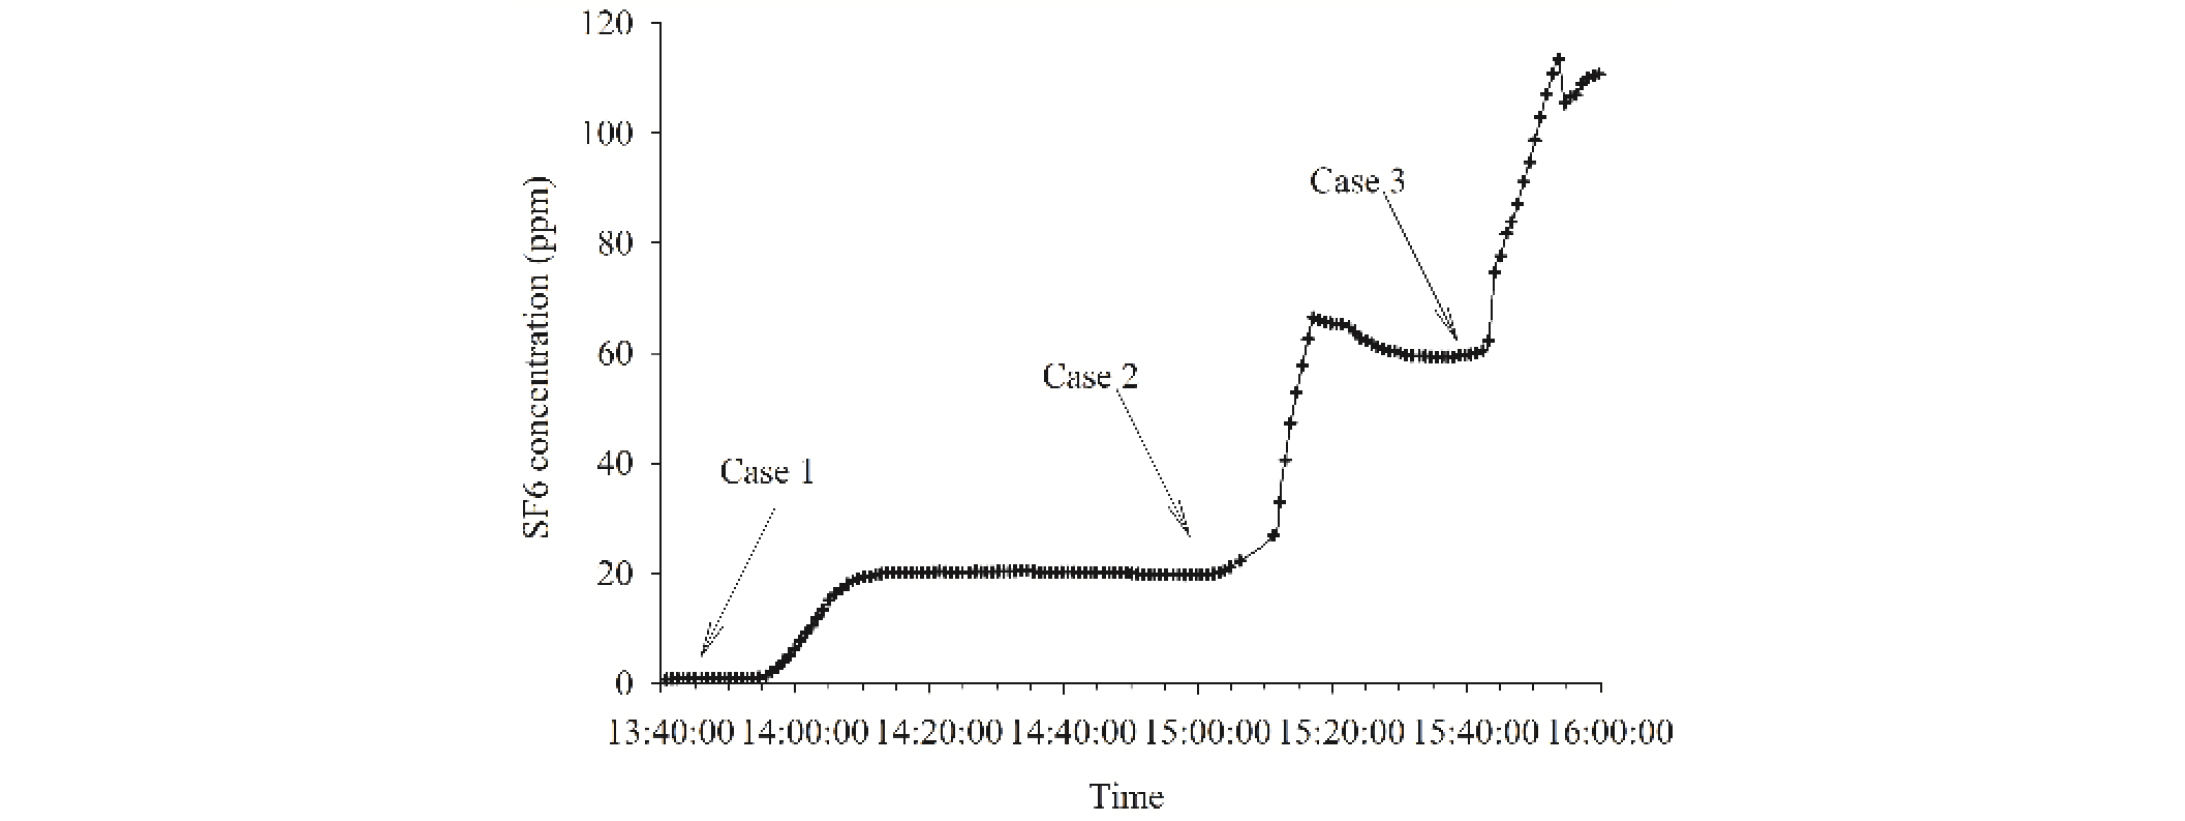
Fig. 16 shows the results of the bimodality analysis of SF6 measurements. Compared to Fig. 7 which was the case of Scenario I, the goodness of fit is clearly improved. This implies that the separate airflows created by two fans behaved more distinctly from each other. This implication can be confirmed by the observations made for the gas exhaust efficiency of the fans.
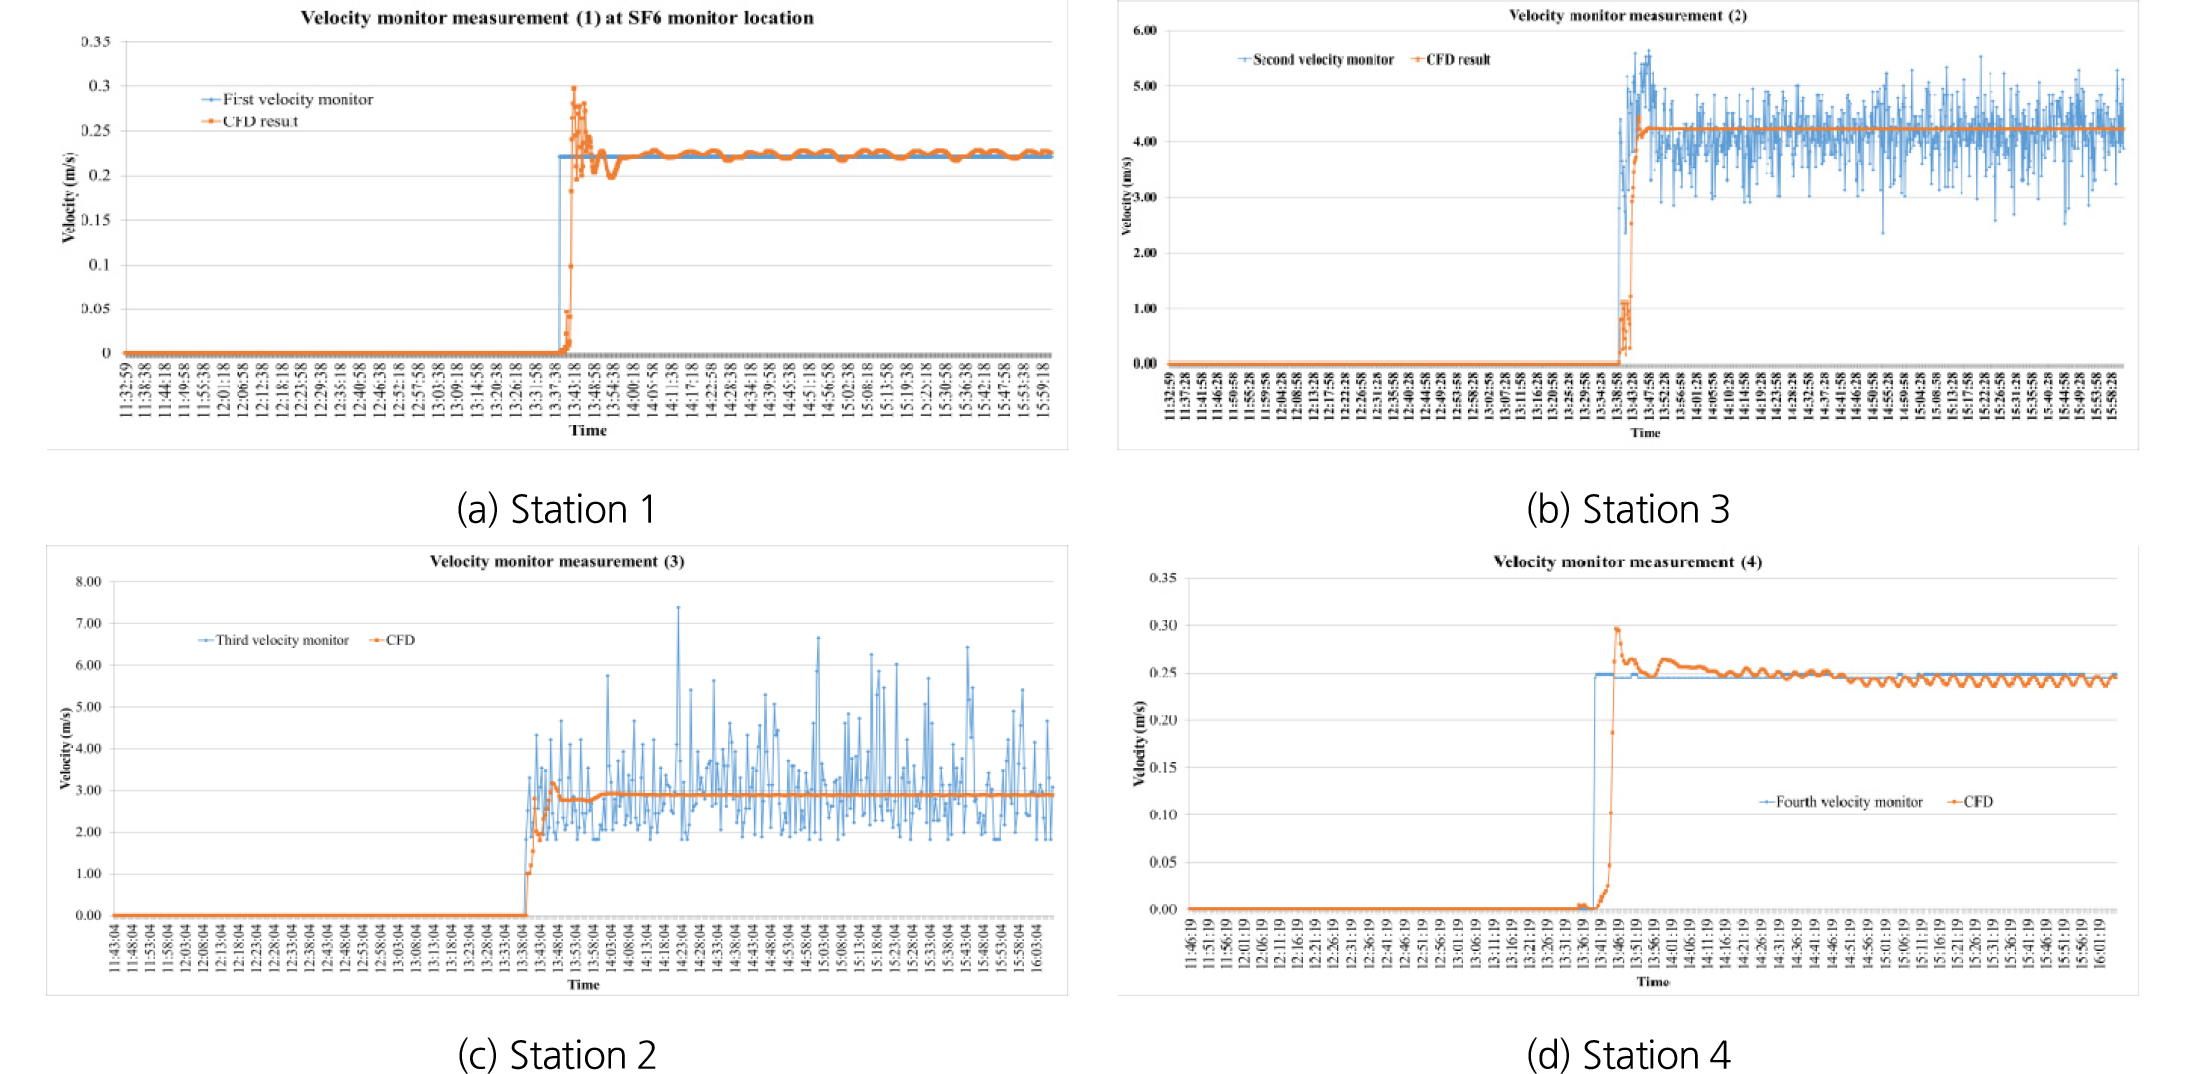
In Fig. 17, measurements of the air velocity at Station 1 to 4 before and after turning on the fans were plotted. It can be seen that Station 2, 40 m downstream the smoke control fan and Station 3, 30 m downstream the site fan were directly influenced by the fan discharge flow and their averages after the fan operation increased to approximately 3.0 m/s and 4.2 m/s, respectively.
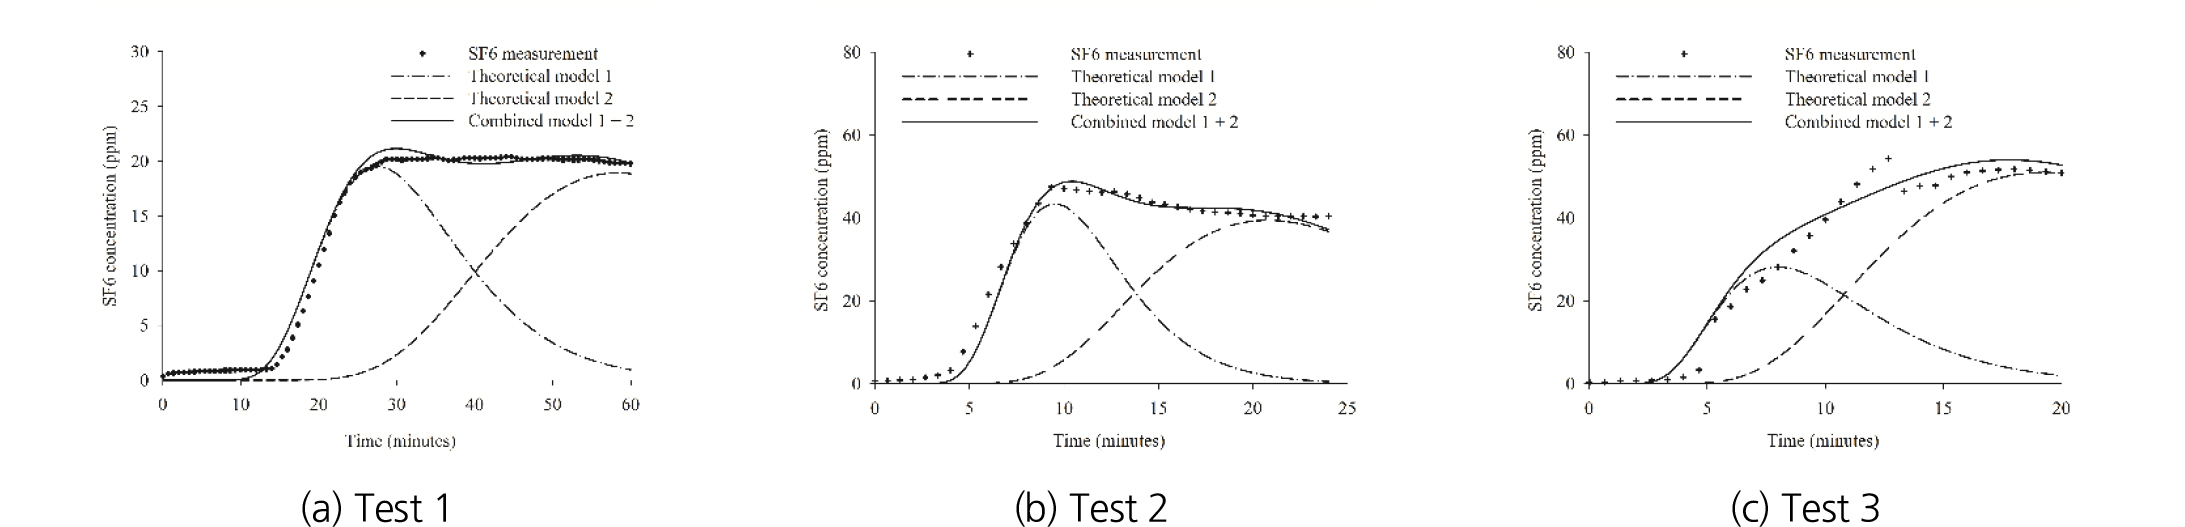
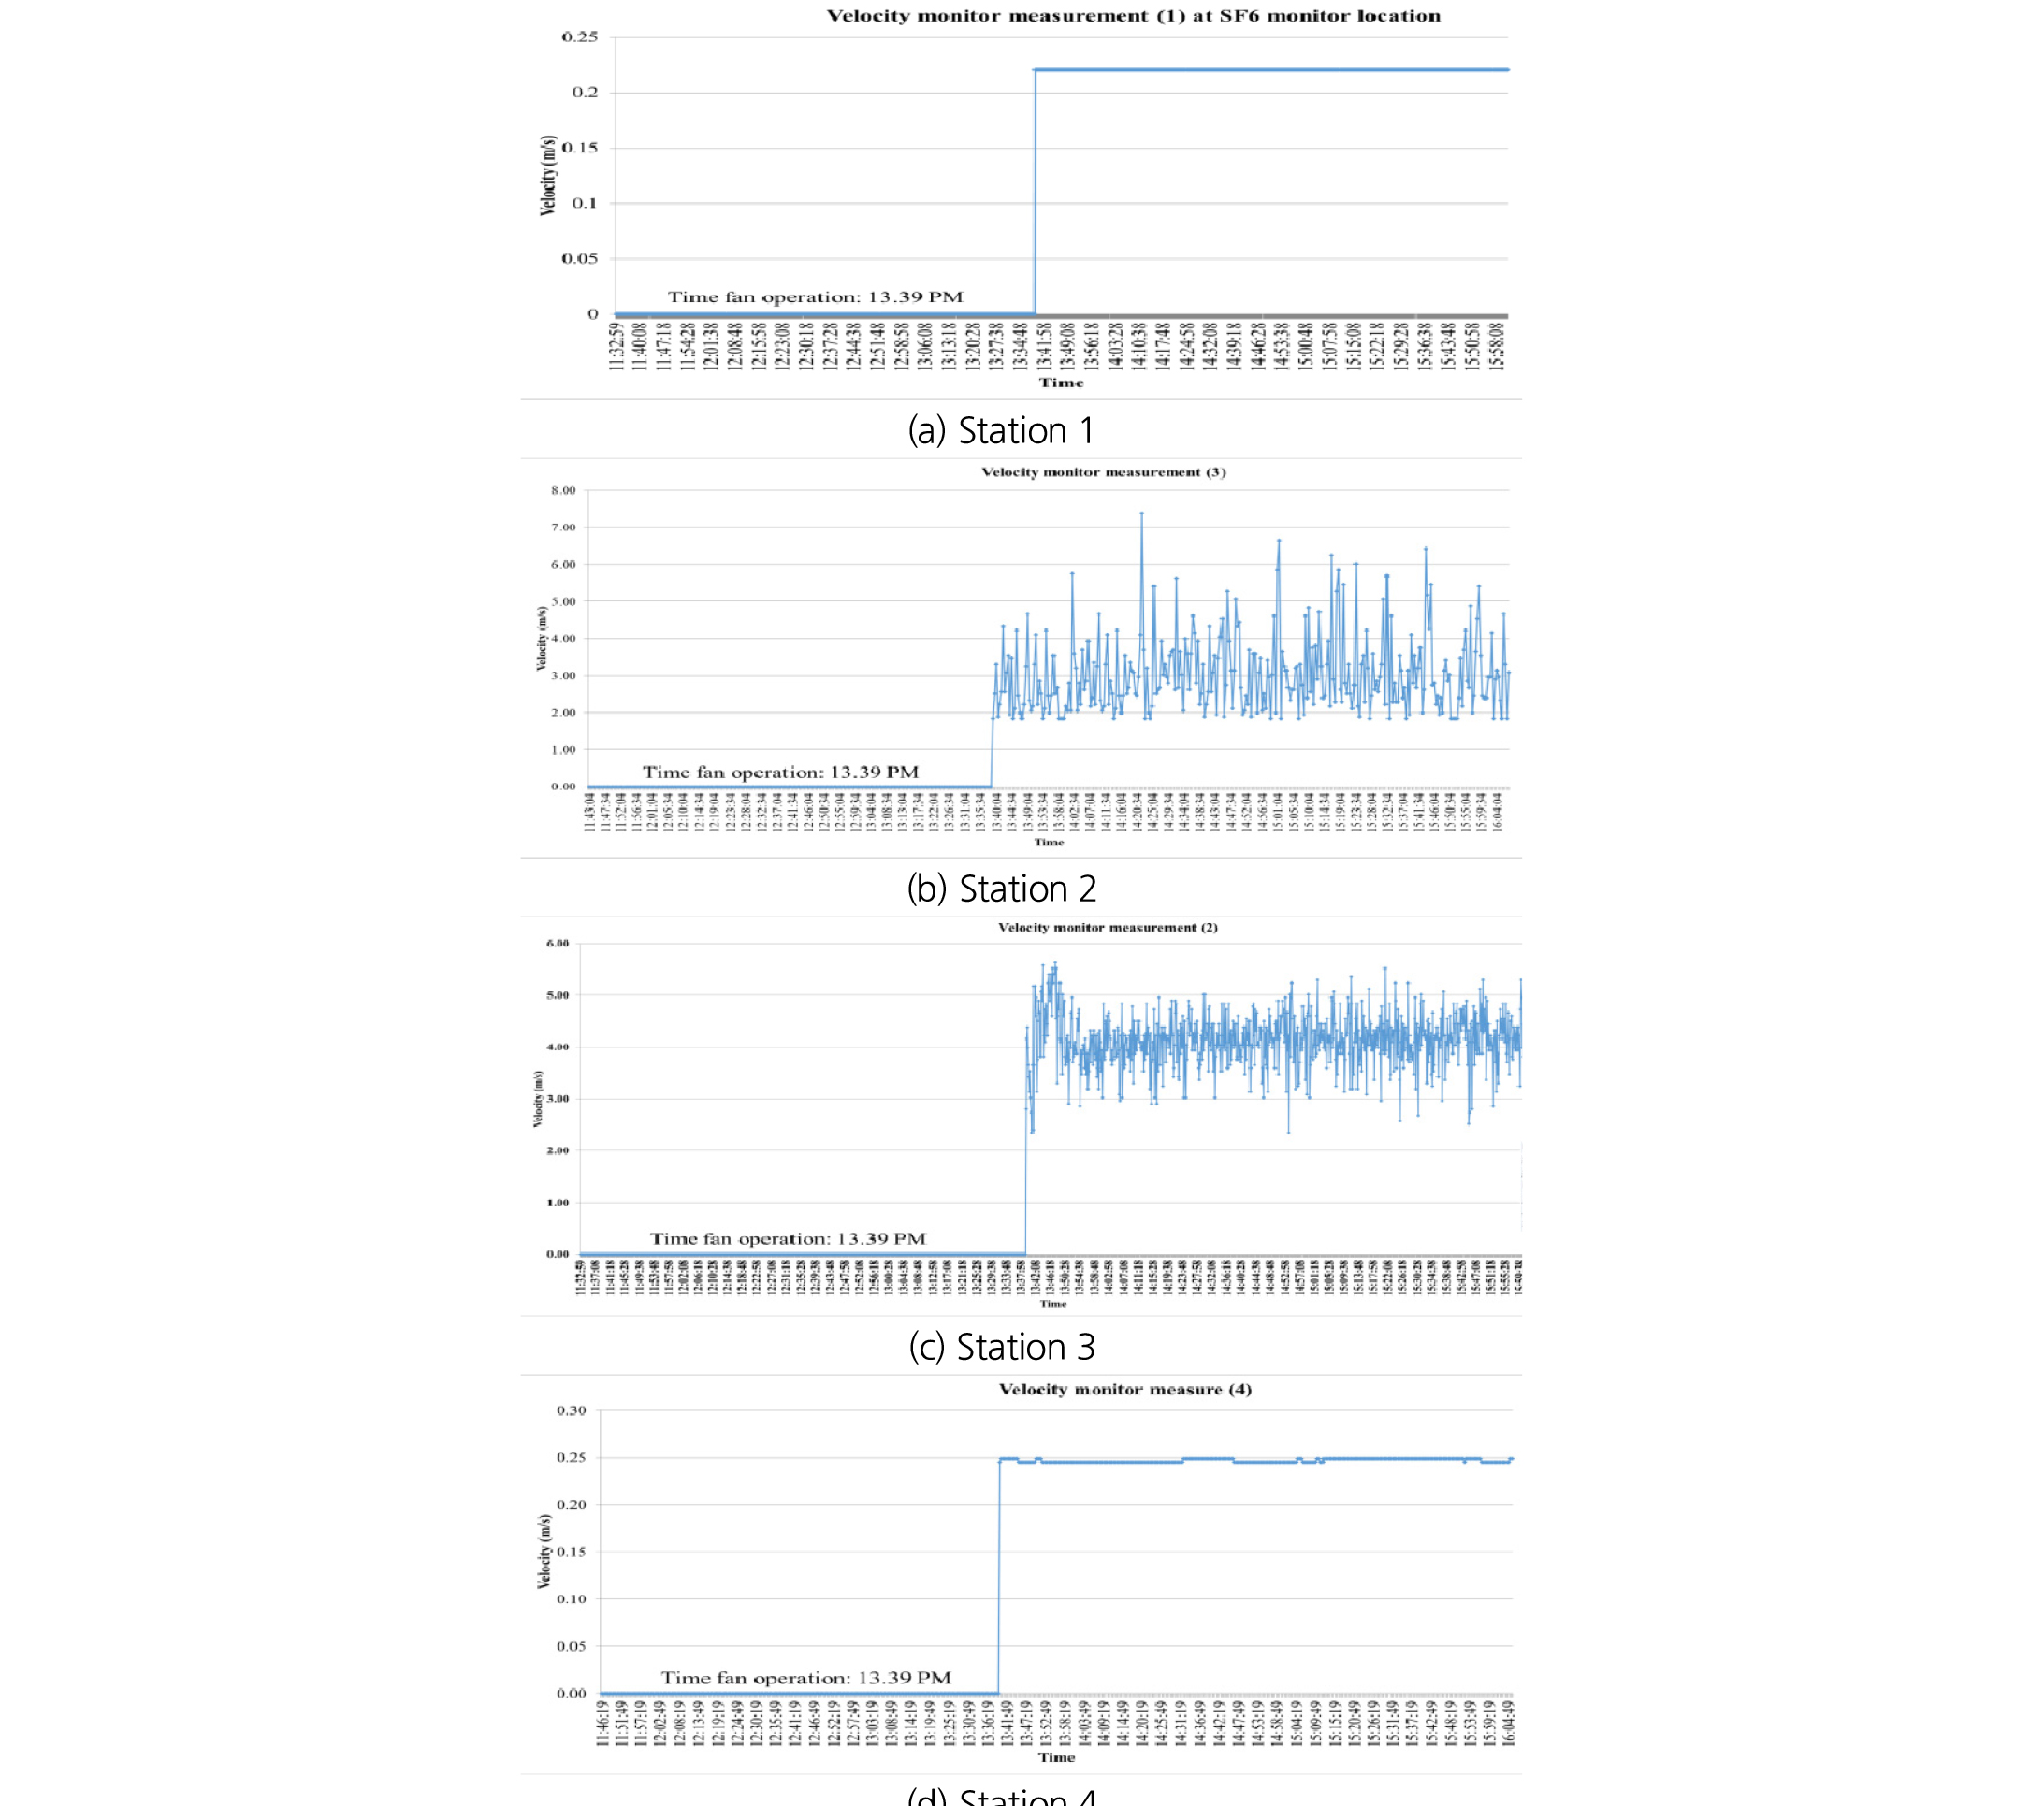
Fig. 18 shows the CO concentration measurements at Station 1. Measurements were started before the fan operation and the profiles collected during the drilling operation clearly shows the effects of the fan; before the fan operation, CO concentrations fluctuated significantly between 75 and 118 ppm but decreased to the stable level of about 70 ppm with the fan operation. Since a drilling machine and several haulage trucks were operated during the entire experiments, CO continued to be injected into the working space. The observation that the fans could maintain the CO level of 70 ppm for 2 hours during the drilling operation indicates that CO was removed at a certain rate by the system with fans. As clearly demonstrated in Fig. 18, the CO concentration decreased by 18% after the fans were turned on. This is in complete contrast to Scenario I which showed gradually increasing concentrations even after running the fans.
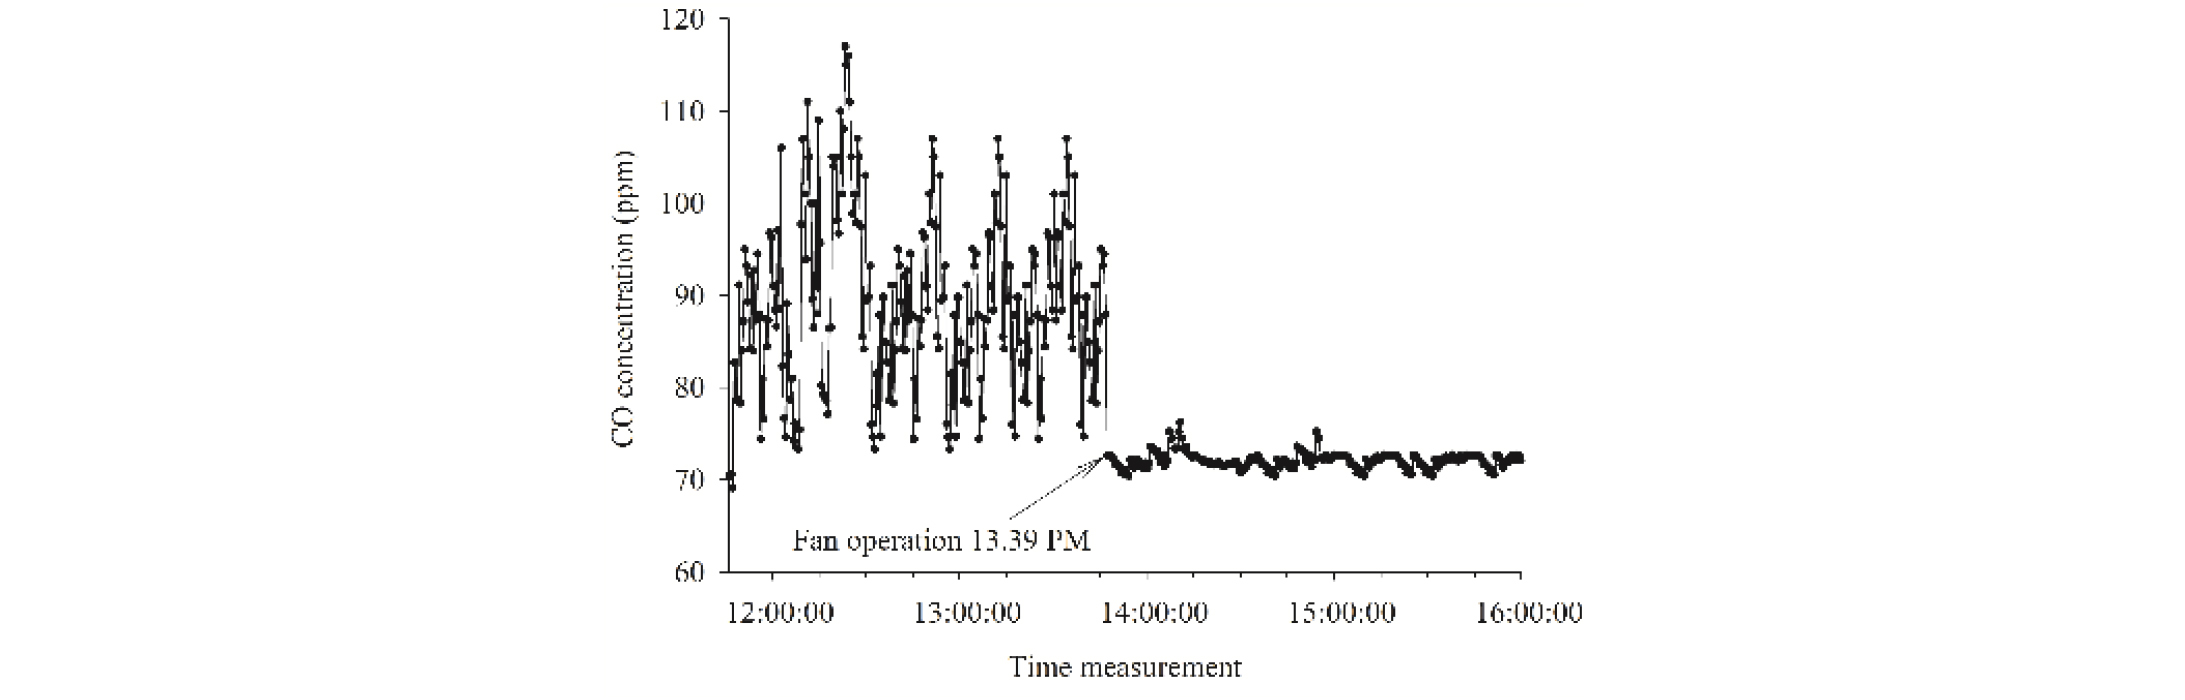
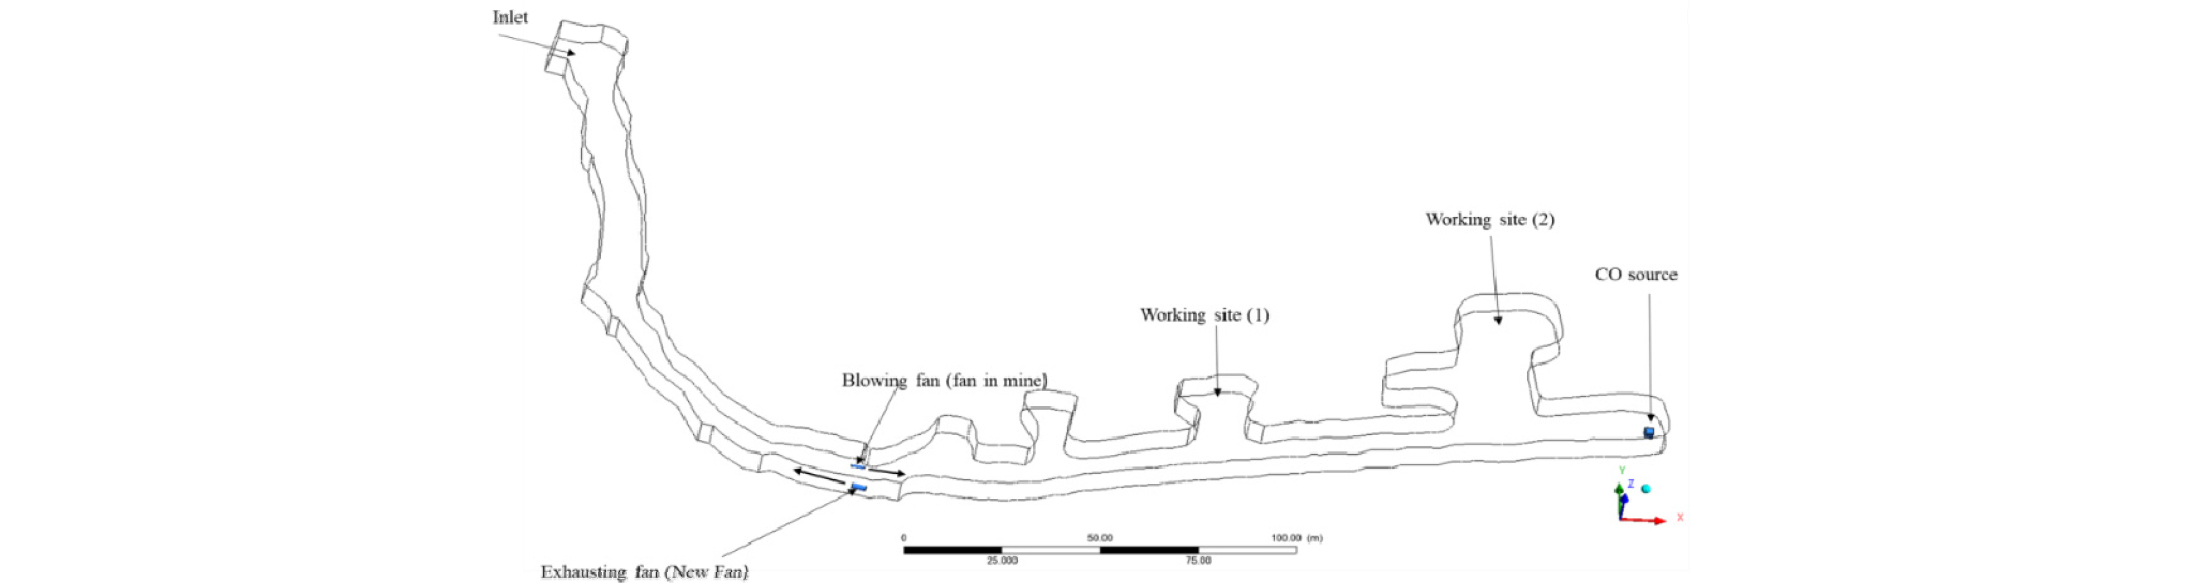
Fig. 19 is the CFD layout of the development entry for Scenario II. As in Scenario I, a CO source of 0.2 kg/s was placed in the face for the fan efficiency evaluation.
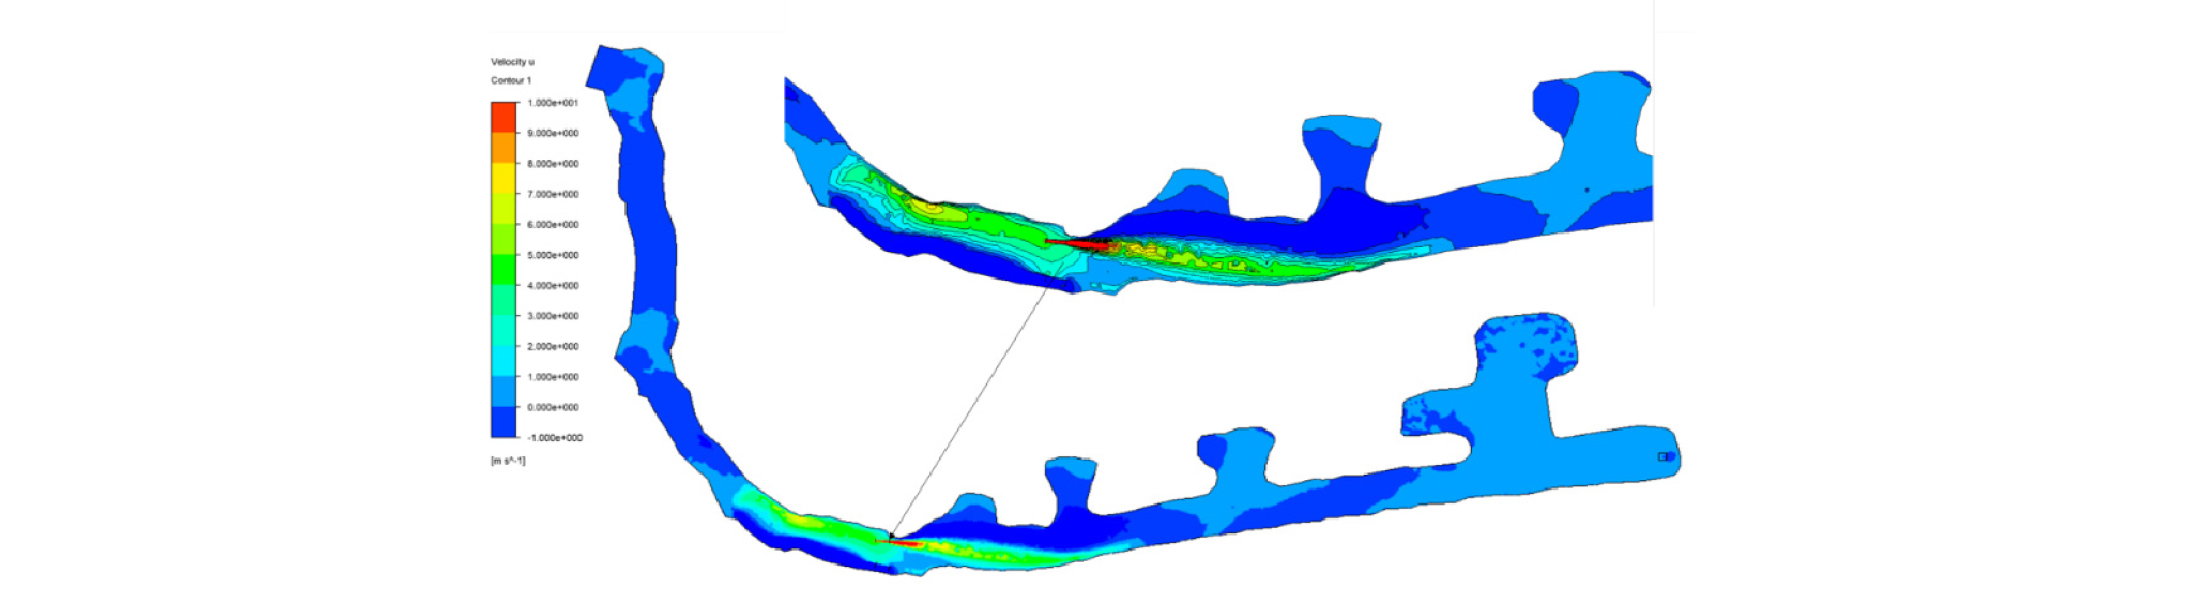
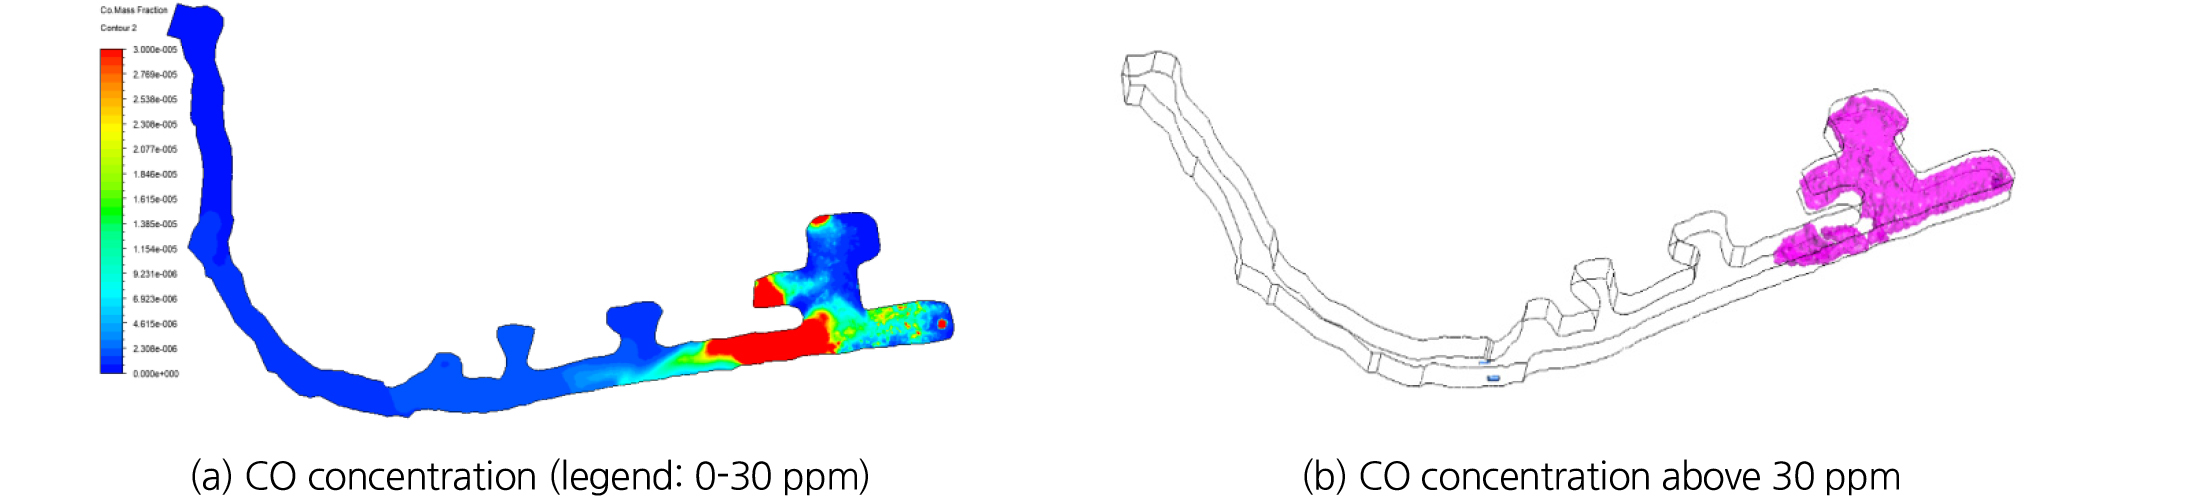
Since the discharge velocity of the unducted site fan was significantly increased from 10 to 38 m/s by removing the tubing, the discharged jet stream could reach the face. This is well depicted in Fig. 20 showing the U-velocity profiles near the face. Due to the changes in the velocity profiles, Fig. 21 shows significantly reduced the area of high CO concentrations and the area with the concentrations higher than 30 ppm is limited to the one cross-cut from the face even after the 2.5 hours-long fan operation. This result implies that it is possible to control the smoke or pollutants continuously discharged from the face by one blowing fan and one exhaust fan. The important factor determining the exhaust efficiency is the movement of the jet streams discharged from the fans; the blowing fan must supply the airflow up to the smoke or pollutant source, while the exhaust fan must have the capacity to deliver the jet stream as far as possible without losing its momentum due to the collision.
As shown in Fig. 22, the CFD analysis results fit the experimental measurements pretty well as in Scenario I. Since Station 2 and 3 are the locations directly influenced by the fan operation, the measurements are noticeably fluctuating with the averages of 3.0 m/s and 4.2 m/s, respectively. In the meantime, the average velocities at Station 1 and 4 are relatively low, 0.22 m/s and 0.25 m/s respectively.
Scenario III
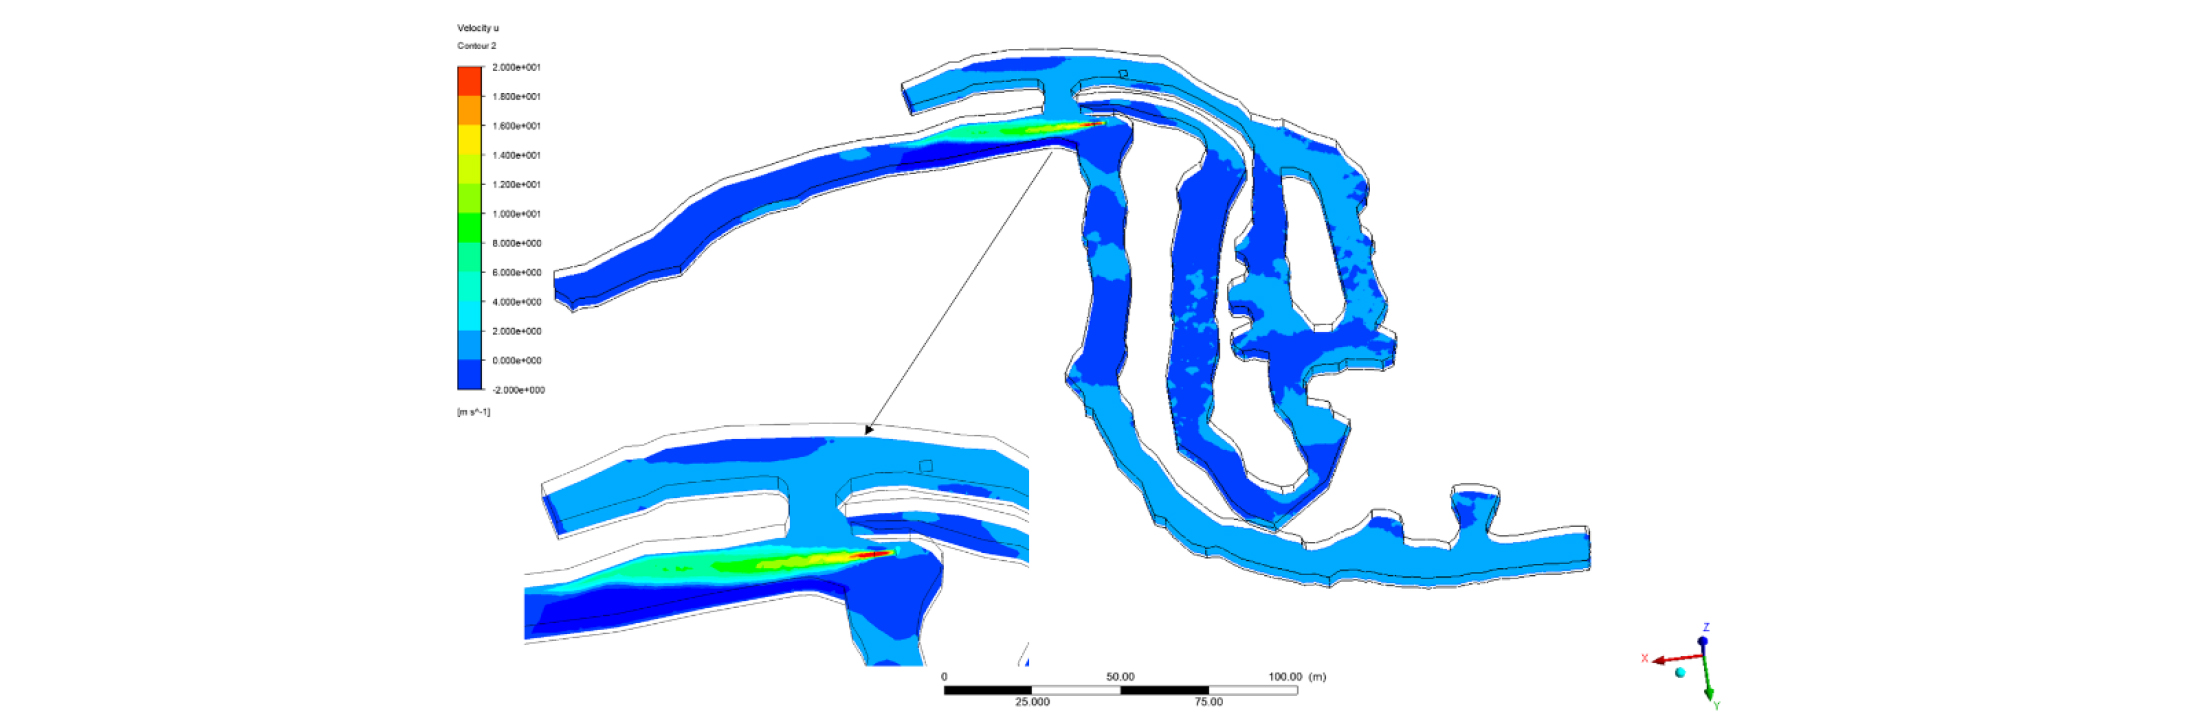
As aforementioned, Scenario III is for testing the possibility of the venturi effects by the jet stream from the smoke control fan. The air flowing toward the location of low static pressure created by the jet stream discharged from the smoke control fan can transport the smoke or pollutants. This is the background for Scenario III. For this purpose, the smoke control fan was placed near the Level 5 entrance as described in Fig. 23 which is the CFD model for Scenario III. Then the fan discharges the jet stream of 38 m/s passing by the entrance. A CO source with the same emission rate of 0.2 kg/s was located inside Level 5, 100 m from the entrance.

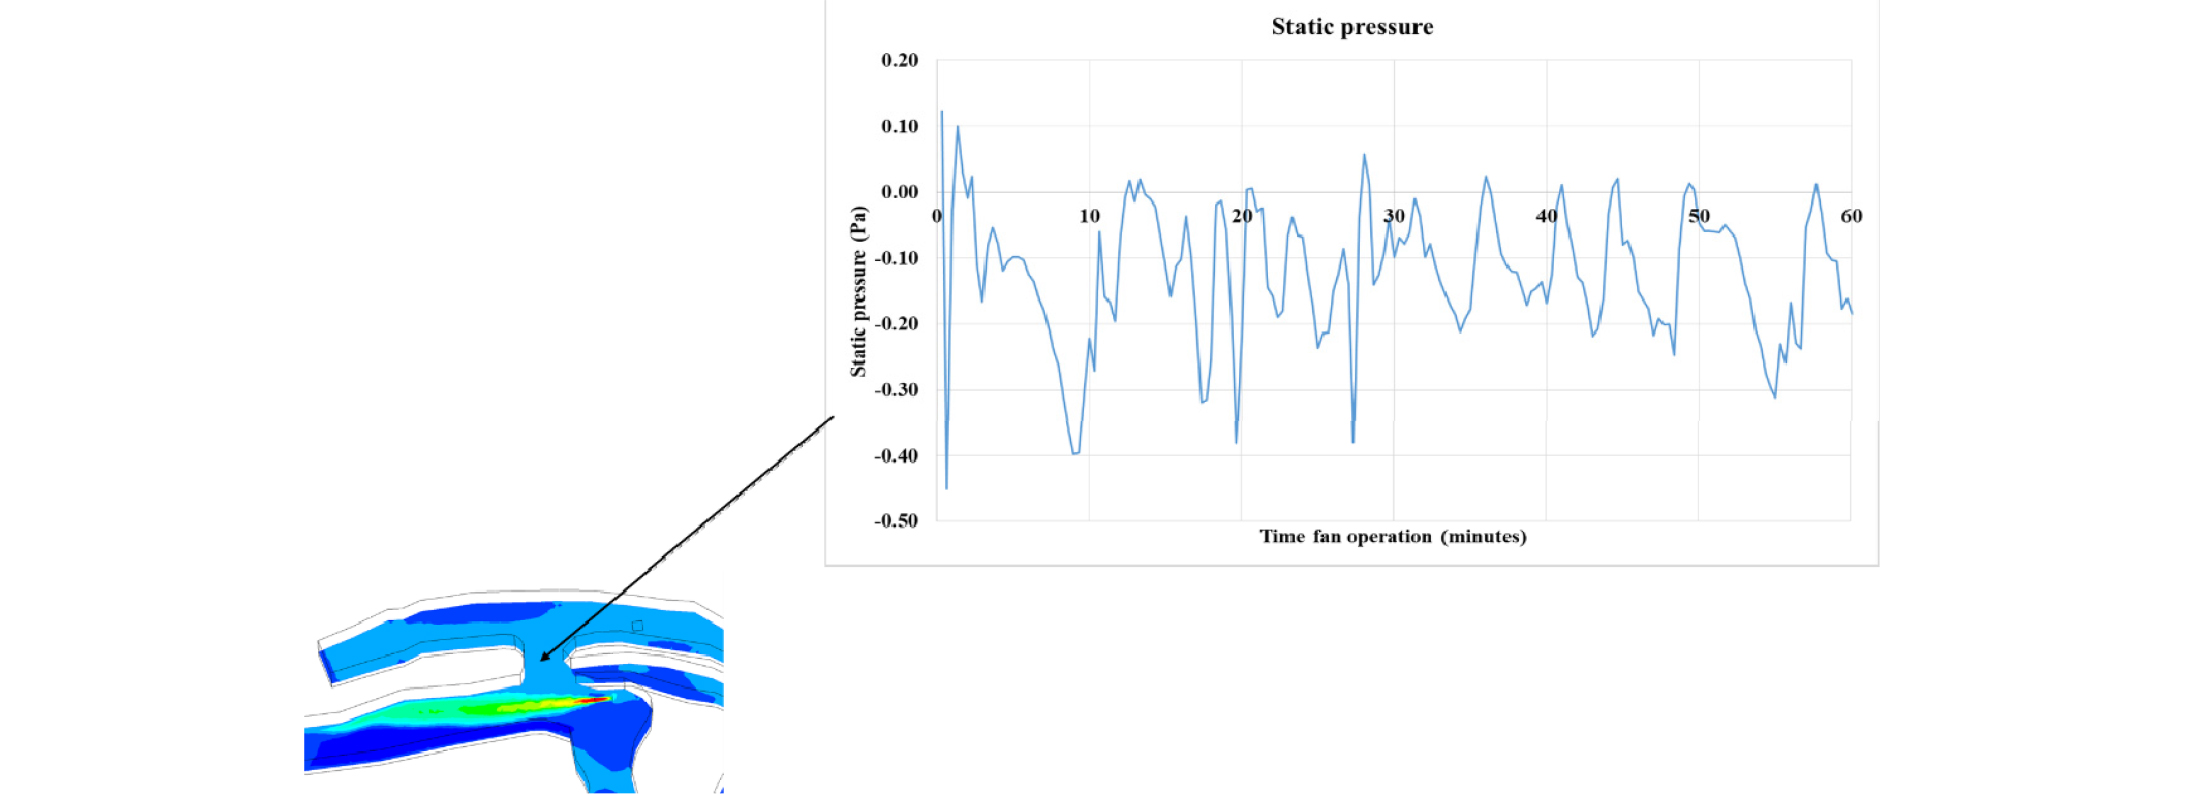
Fig. 24 and 25 show the distributions of the air velocity over the test site and the static pressure at the junction of the Level 5 and the rampway. As shown in Fig. 24, the jet stream of 30 m/s discharged from the smoke control fan passed by the junction at a very high velocity and subsequently lowered the static pressure. The changes in the static pressure at the junction by time are well plotted in Fig. 25 and it shows that the static pressure is kept below zero. This negative static pressure maintained at the junction resulted in the diffusion of CO out of Level 5 into the rampway. Fig. 26 which describes the CO concentration distributions by the fan operating time clearly shows the transport of CO into the rampway through the junction.
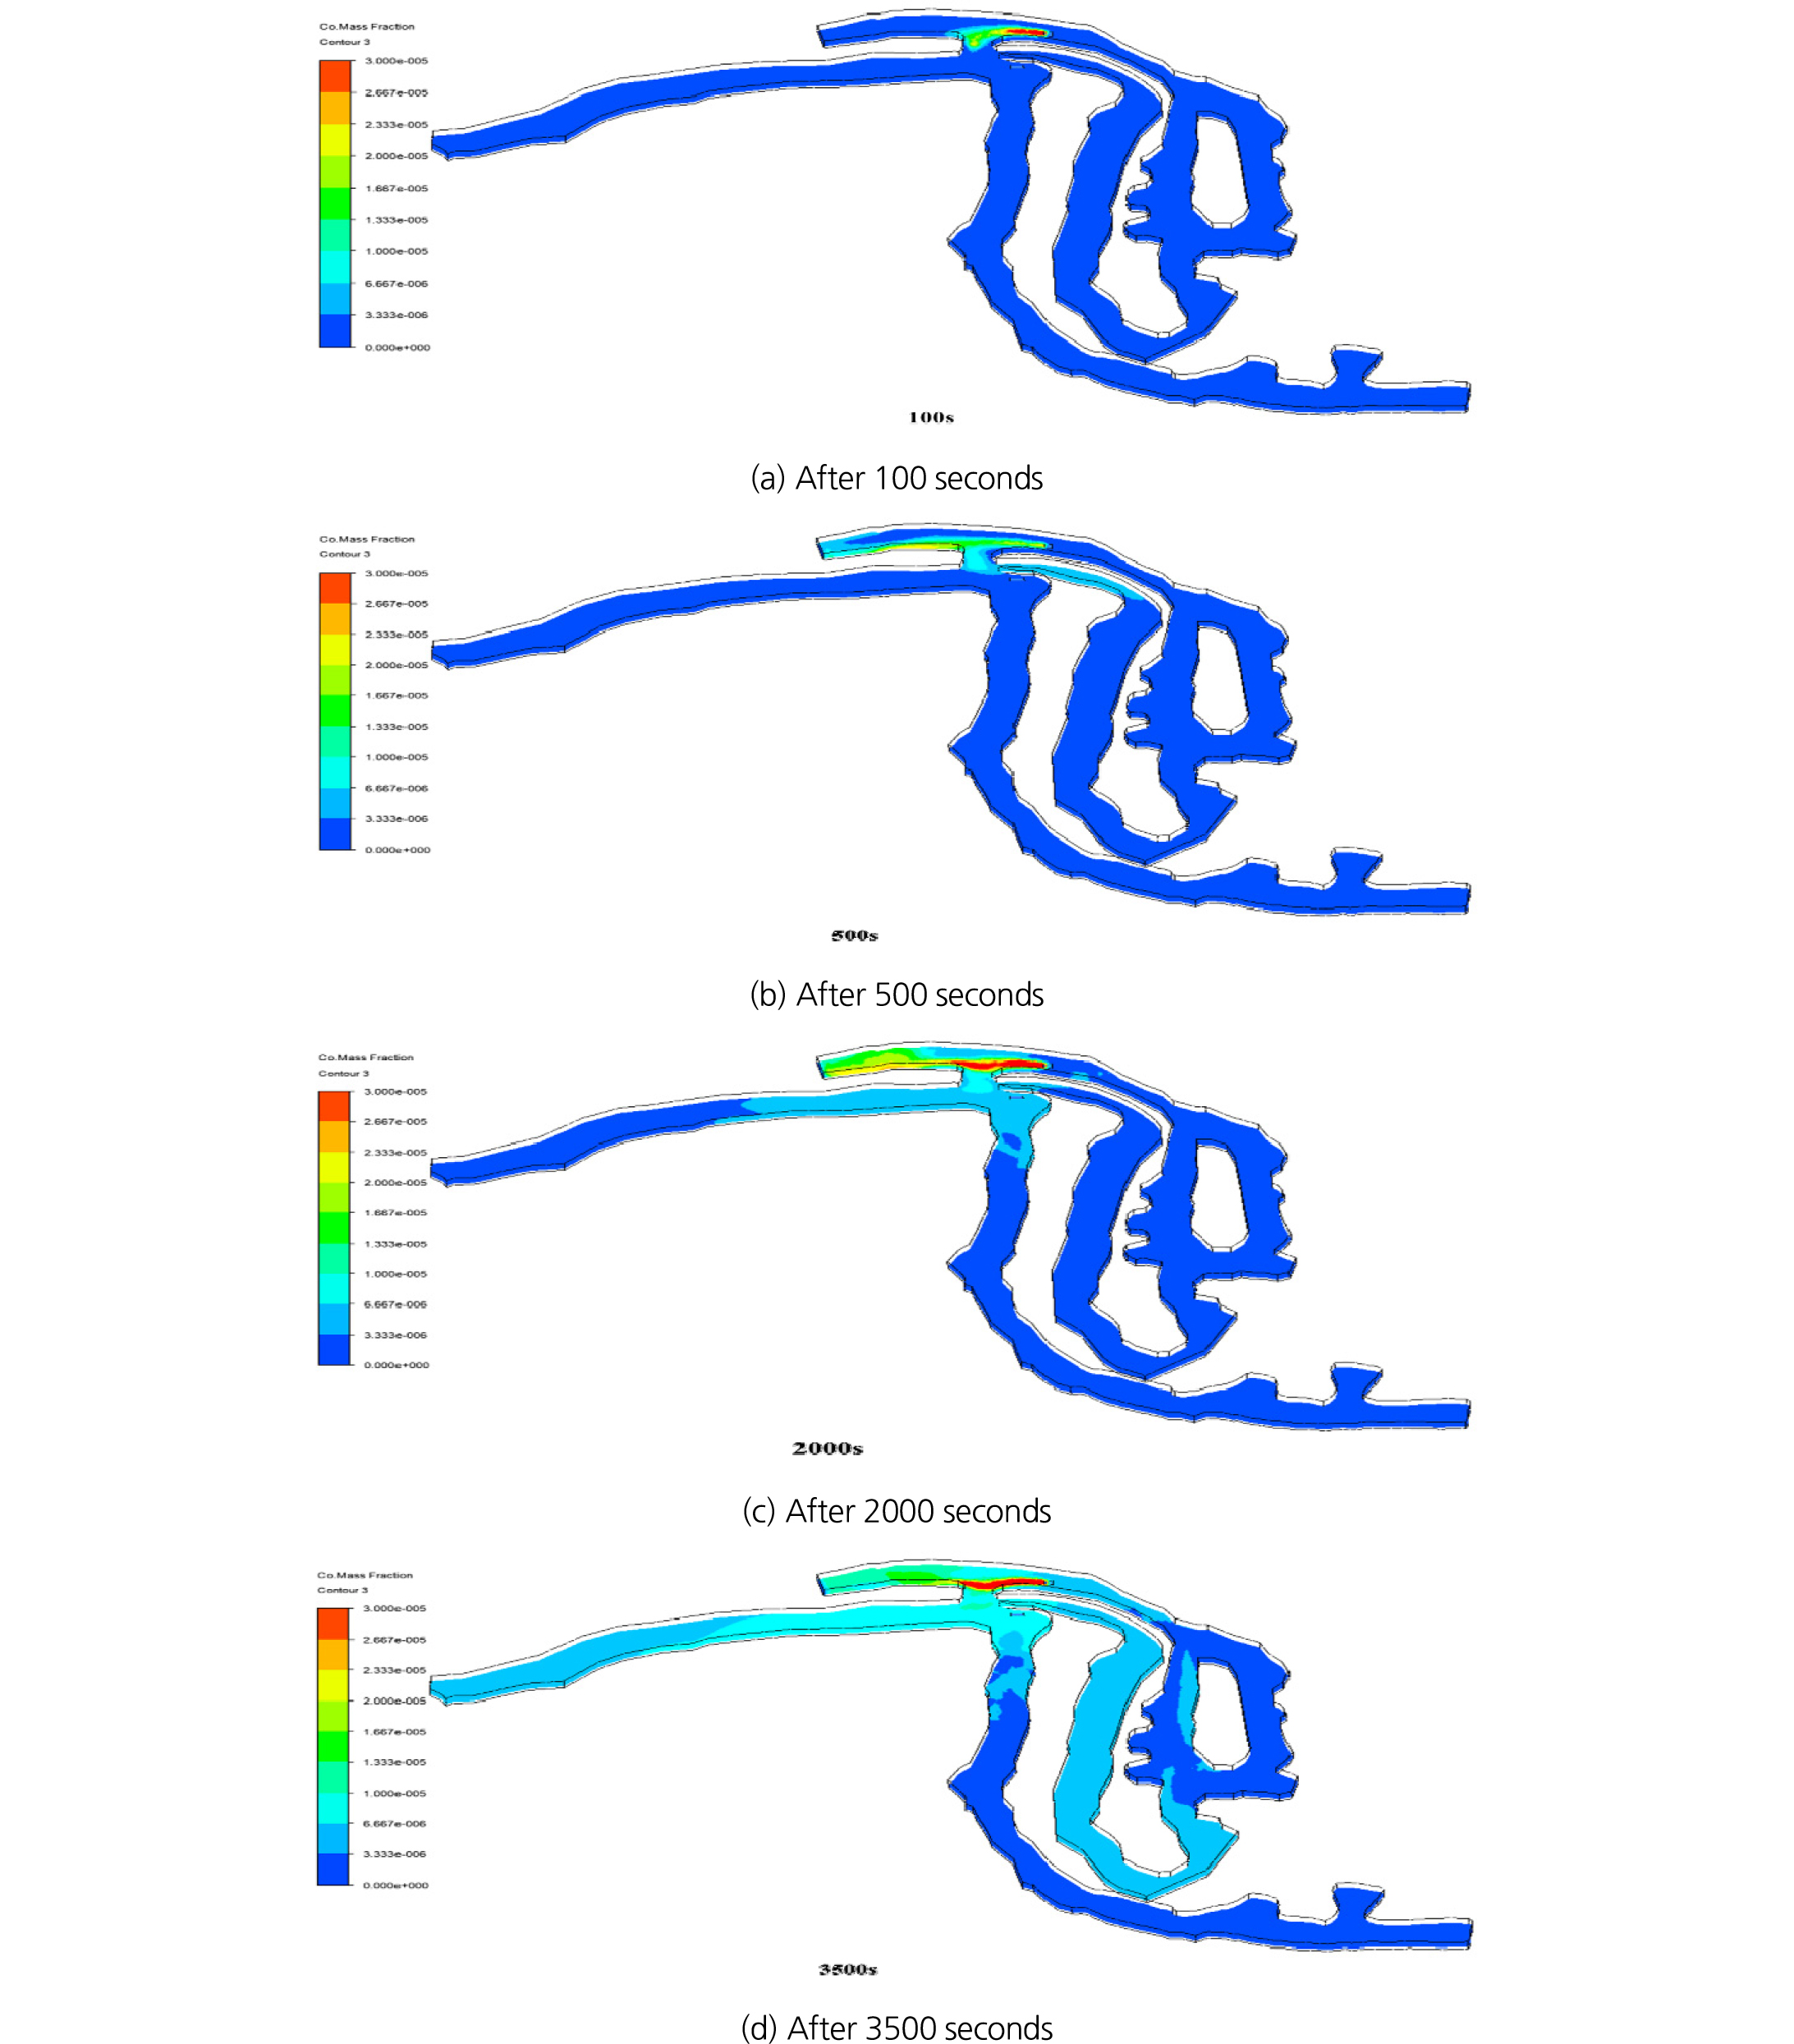
It can be seen that after 100s of the fan operation, CO generated inside Level 5 started to be exhausted via the junction. As the time went by, more CO was exhausted from Level 5 into the rampway. The venturi effects by the high capacity fan such as the smoke control fan developed in this study can be effectively utilized in the situation where it is realistically impossible to install the smoke control fan inside a blind entry caught in the fire.
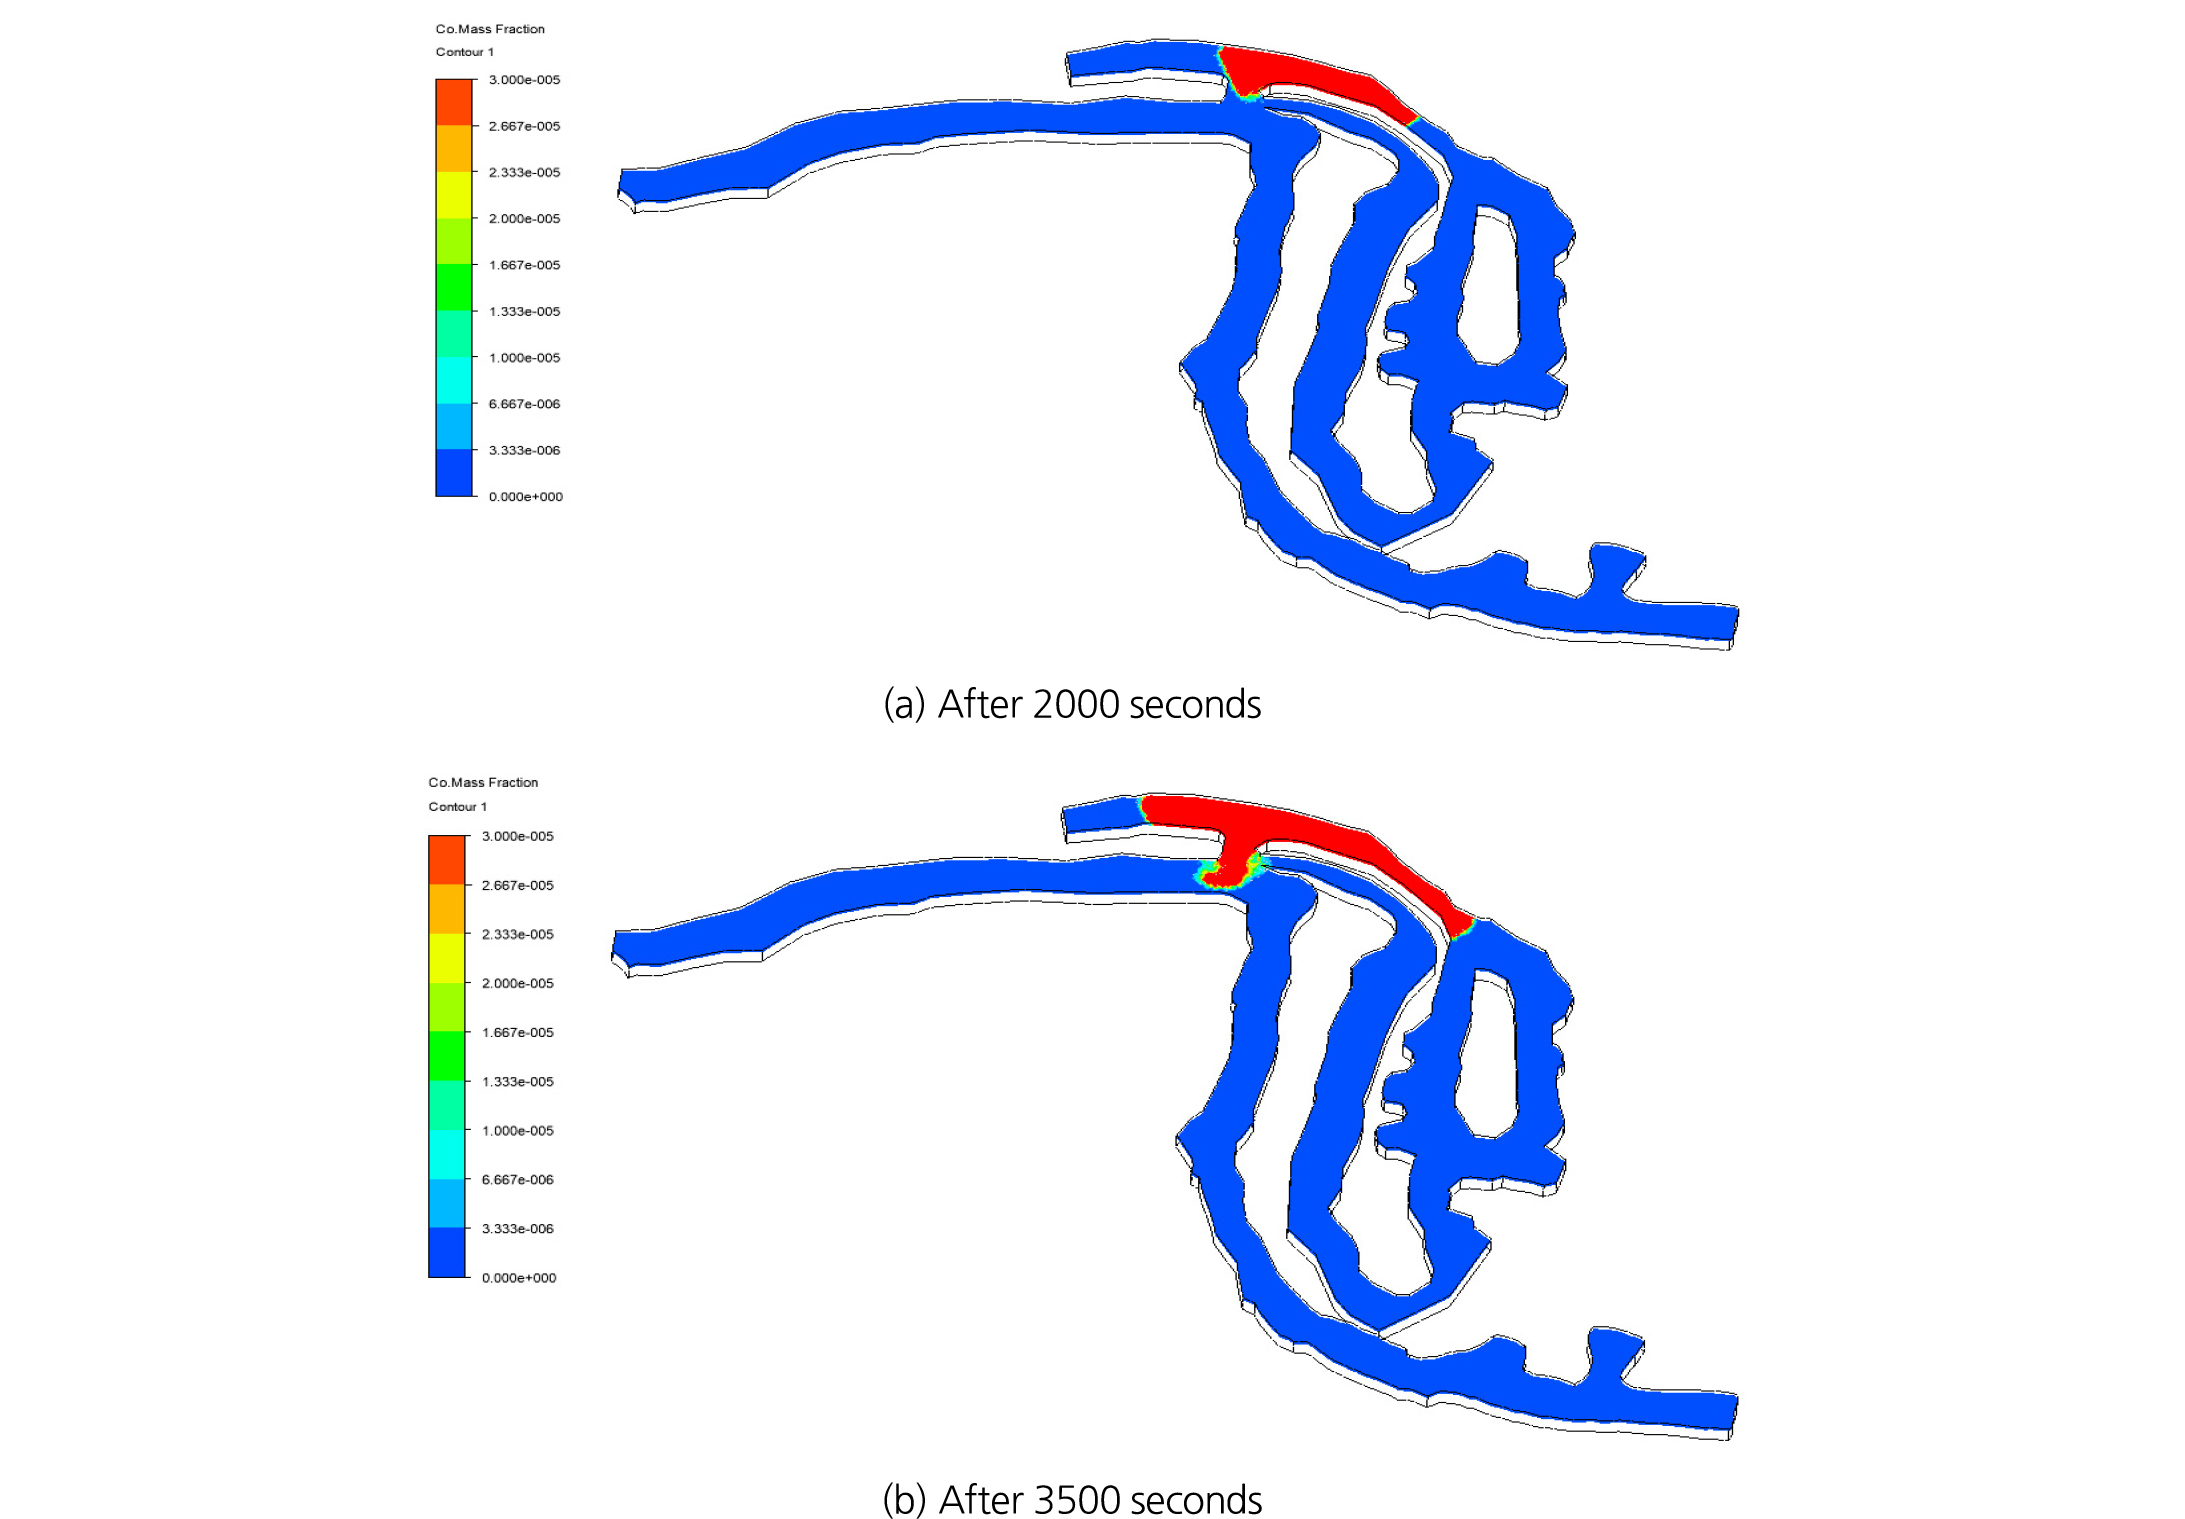
Fig. 27 shows the CO concentration distributions without fan operation. It can be seen that due to the natural diffusion, the area showing CO higher than 30 ppm expands only inside the Level 5 even after 2000 seconds. Furthermore, Fig. 27(b) shows that CO continues to propagate deep into Level 5, but it does not dissipate to the rampway via the junction move at 3500 seconds. This distinct differences from the case with fan operation in Fig. 26 indicate that the venturi effects can be utilized for controlling the fire smoke by fan operation.
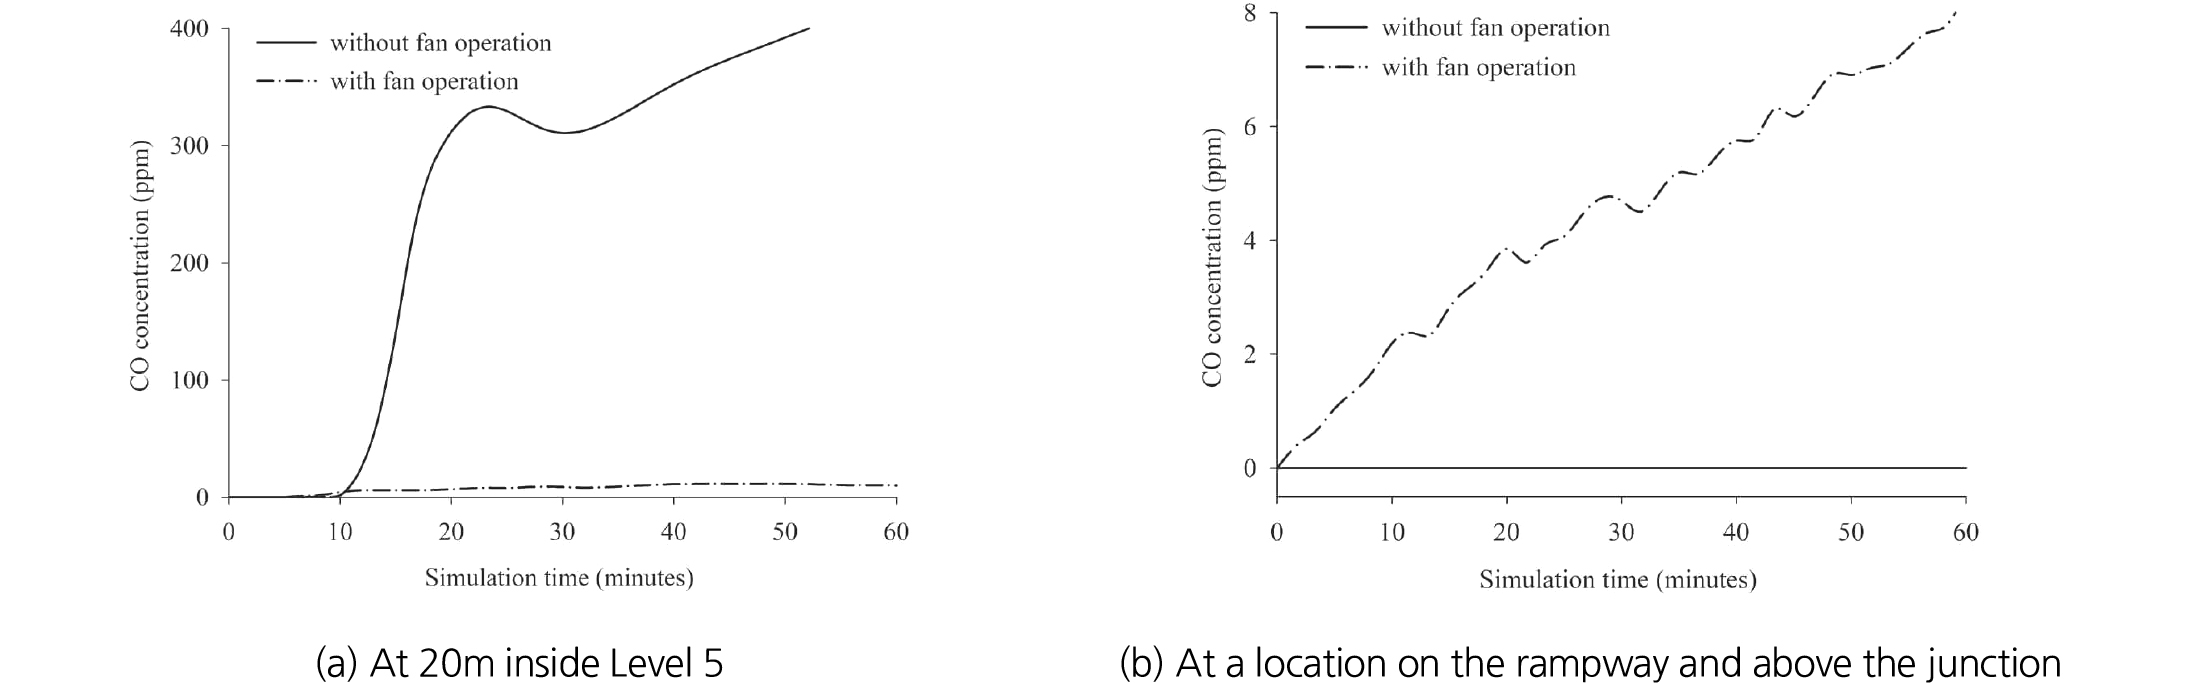
To demonstrate the efficiency of smoke exhaust fan, the CO concentrations at two locations, 20 m inside Level 5 and on the rampway, just above the junction, are plotted in in Fig 28. Fig. 28(a) shows the CO profiles at the location inside Level 5. CO level after the fan was turned on was much lower than in the case without the fan, and the average reduction reached 97%. Fig. 28(b) shows the CO levels at the site on the rampway and just above the junction; it clearly shows that significant amount of CO was extracted with the fan operation. The figure shows that the smoke exhaust fan operated on the rampway, just below the junction, to achieve the venturi effect can effectively control the fire smoke and keep Level 5 safe for workers’ evacuation during a fire inside Level 5.
CONCLUSIONS
To control the fire smoke or blast gases in the blind entry development sites, a 37 kW Φ1400 fan was developed and its control efficiency was evaluated in a local large-opening limestone mine. Three scenarios designed with different fan installation location and operating mode were studied by site experiments and also CFD analysis. The results indicate that the fire smoke and blast gases in the blind entry can be effectively removed by employing two fans in a proper manner. Several important results are summarized as follows:
1.It is found to be effective to employ two fans; one blowing and the other exhaust fan without tubing. The blowing fan with high capacity supplies the airflow up to the fire or contaminant source and then enhances the turbulence intensity in the working space, while the exhaust fan is brought in to remove the smoke or contaminants. The average CO concentration was reduced by 18% when the fans were turned on. Thus, other than the smoke control fan developed in this study, a blowing fan is required to blow the air to the face as close as possible.
2.The required fans must be installed to prevent the discharged jet stream from colliding with the entry walls, floor, and ceiling in order to minimize the momentum loss. This can maximize the distance straightly traveled by the stream and minimize the recirculation of the airflow.
3.In the long blind entries, recirculation is difficult to control in case of the push-pull system with two fans. This study shows that outlet of the unducted blowing fan should be located ahead of the inlet of the exhaust fan to minimize the recirculation.
4.The venturi effects can be effectively applied to remove the hazardous matters from the blind entry where there is no place to install fans inside. This can be achieved by employing a high-capacity smoke control fan near the junction and blowing the air at a high speed. The static pressure at the junction will be reduced due to the increase in the kinetic head; subsequently, the fire smoke or pollutants will be transported from the inside to the junction. CO was shown to be extracted and CO concentration just inside the level with a CO source was reduced by 97% compared to the case without the fan. It implies that workers trapped in the blind level with a fire can stay there safely during the fan operation.
5.This study was intended to provide an easy and economical method for controlling the fire smoke and also blast gases from the blind entry development sites. Employing unducted fans for this purpose is recommended to respond to the emergency situations as in case of fire and also promptly remove the blast gases in order to minimize the production loss time.
