

1. Introduction
1.1 Reservoir compaction and seismicity history in Groningen
1.2 Pressure maintenance concept and the objective of the study
2. Groningen reservoir model with PFC2D
2.1 Model generation in 2D
2.2 Distribution of production clusters and pressure depletion
3. Modelling depletion induced seismicity
3.1 Evolution of reservoir pressure and seismicity
3.2 Stress analysis
3.3 Compaction and subsidence analysis
4. Summary and conclusions
1. Introduction
1.1 Reservoir compaction and seismicity history in Groningen
Production within the Groningen gas field has caused substantial pressure depletion, accompanied by subsurface deformation and ground subsidence. From 1995 to 2017, pressure has reduced from 25 MPa to 12 MPa at a mean rate of approximately 0.2 MPa/year (Bourne et al., 2018). Depletion of the porous gas field causes compaction, accompanied by stress changes within the reservoir and surrounding area (Buijze et al., 2017, 2019, Nepveu et al., 2016). Given the coupling of the reservoir to the surrounding rock volume, the decreased reservoir volume results in reduced total horizontal stress, increasing the differential stress within the reservoir and possibly activating faults.
Since 1995, KNMI (Koninklijk Nederlands Meteorologisch Instituut, The Royal Netherlands Meteorological Institute) has operated a near-surface seismic monitoring network in the northeastern region of the Netherlands, which has reported all ML≥1.5 earthquakes since the time of operation (Dost et al., 2012). Most induced seismicity tends to occur in the northwest part of the Groningen gas field, and to some extent in the southwest. In particular, faults that incorporate Basal Zechstein anhydrite-carbonate material from the top of the reservoir are expected to have a higher seismogenic potential (Hunfeld et al., 2017). As of 2017, more than 1000 M>1 earthquakes had been recorded, most notably the Mw 3.6 Huizinge earthquake (Buijze et al., 2017), which occurred on 16 August 2012. This earthquake was the largest recorded induced earthquake in the Netherlands and caused substantial damage to infrastructure and housing, rendering several homes uninhabitable. More recently, on 22 May 2019, the ML3.4 Westerwijtwerd earthquake occurred in the northwestern area of the gas field (van Elk and Doornhof, 2019). This earthquake was the third largest to occur in Groningen, with a similar magnitude to the Zeerijp earthquake from 8 January 2018.
Fig. 1 (a) shows the spatial distribution of the Groningen gas field seismicity. The symbol size scales with the moment magnitude. The seismicity is distributed into two major clouds which are both elongated along northwest-southeast orientation. Fig. 1 (b) shows gas production history (bcm: billion cubic meter) overlain by the evolution of earthquake occurrence (number of earthquakes and their magnitude distribution). As seismicity monitoring in the Groningen gas field started in 1990, the correlation between gas production record and seismicity occurrence is shown from 1990. From 1990-2020, during which time the production and seismicity histories are displayed, there is a clear correlation between increased production levels and increased earthquake rates and magnitudes and vice versa. From 2010, a sharp increase in the seismicity rates is observed, which persists into 2017 and decreases afterwards, though rates remain elevated compared to those prior to 2010. The continuously-elevated earthquake rates show a delay in seismicity with respect to production times, as the production volume decreases sharply from 2013. By contrast, the magnitudes of the induced earthquakes are more closely correlated in time to production volume; the rates of ML≥1.5 earthquakes reach a maximum at the same time as production volume. Overall, these results indicate that earthquake rates can be lowered through stopping production; however, the effect is not immediate and a substantial reduction in induced seismicity would only have been possible through stopping production before 2020, or even 2010.
1.2 Pressure maintenance concept and the objective of the study
A consequence of gas production in the Groningen field was reservoir subsidence. As the pore pressure decreases during depletion, the reservoir compacts, and stresses along pre-existing faults increase. This in turn increases the instability of some faults, triggering induced earthquakes (Hofmann et al., 2016). During the past decades, pressure maintenance has been investigated as a method to counteract the pressure depletion caused by gas production, thereby reducing the number and magnitude of earthquakes. Through injection of fluids such as N2, CO2, or water, the effects of depletion can potentially be offset, maintaining pressures throughout the reservoir. Through injection at specific sites with high depletion levels, pressure levels can also be redistributed, thus reducing spatial imbalances that can trigger earthquakes.
TNO (Nederlandese Organisatie voor Toegepast Natuurwetenschappelijk Onderzoek, Nethderlands Organisation for Applied Scientific Research), and NAM (Nederlandse Aardolie Maatschappij, Dutch Petroleum Company) have extensively studied the feasibility of pressure maintenance by large-scale fluid injection (Bourne and Oates, 2019, van den Bogert, 2018, Hofmann et al., 2016, Guises et al., 2015, van Thienen-Visser et al., 2015, 2016). Overall, they concluded that injection can maintain reservoir pressure in depleting reservoirs and that fluid injection is technically feasible. However, the overall net effect of large-scale fluid and gas injection on the seismic risk profile was not quantified, as the seismic risk associated with various fluid and gas injection scenarios was only studied qualitatively.
Therefore, the question of whether fluid and gas injection can be used to minimize the risk of induced seismicity in depleting reservoirs remains unanswered, as TNO and NAM studies did not involve simulation of dynamic fault ruptures induced by fluid and gas injection, and the subsequent generation of earthquake magnitudes from the resulting seismicity.
This paper presents Part I of the research project entitled “Effect of pressure maintenance by fluid injection on seismic risk”, funded by the Dutch Ministry of Economic Affairs and Climate Policy. The objective of the research project is to investigate the following questions:
∙What are possible injection scenarios for pressure maintenance during and after production and for minimizing the pressure difference across the field?
∙What are the reservoir stresses and pressures for various fluid and gas injection scenarios around wells and over the entire gas field?
∙How can the Groningen seismic module be adapted for injection to increase or decrease pressure?
∙What is the effect of fluid and gas injection on the overall seismic risk?
∙What is the effect of fluid and gas injection on seismicity near injection wells?
∙What is the most optimal configuration of injection wells?
∙What is the overall effect of fluid and gas injection on seismicity and what are the recommendations for the Groningen HRA (Hazard Risk Assessment) model?
In this study, we focus on modelling the pressure depletion of the Groningen reservoir through applying hydro-mechanically coupled 2D discrete element modelling using Particle Flow Code 2D (PFC2D). Part II of the research project is to test various injection scenarios to mitigate occurrence of future seismicity as a result of 60 years of depletion time, and understand how the seismic hazard and risk profile changes with injection as a means of pressure management.
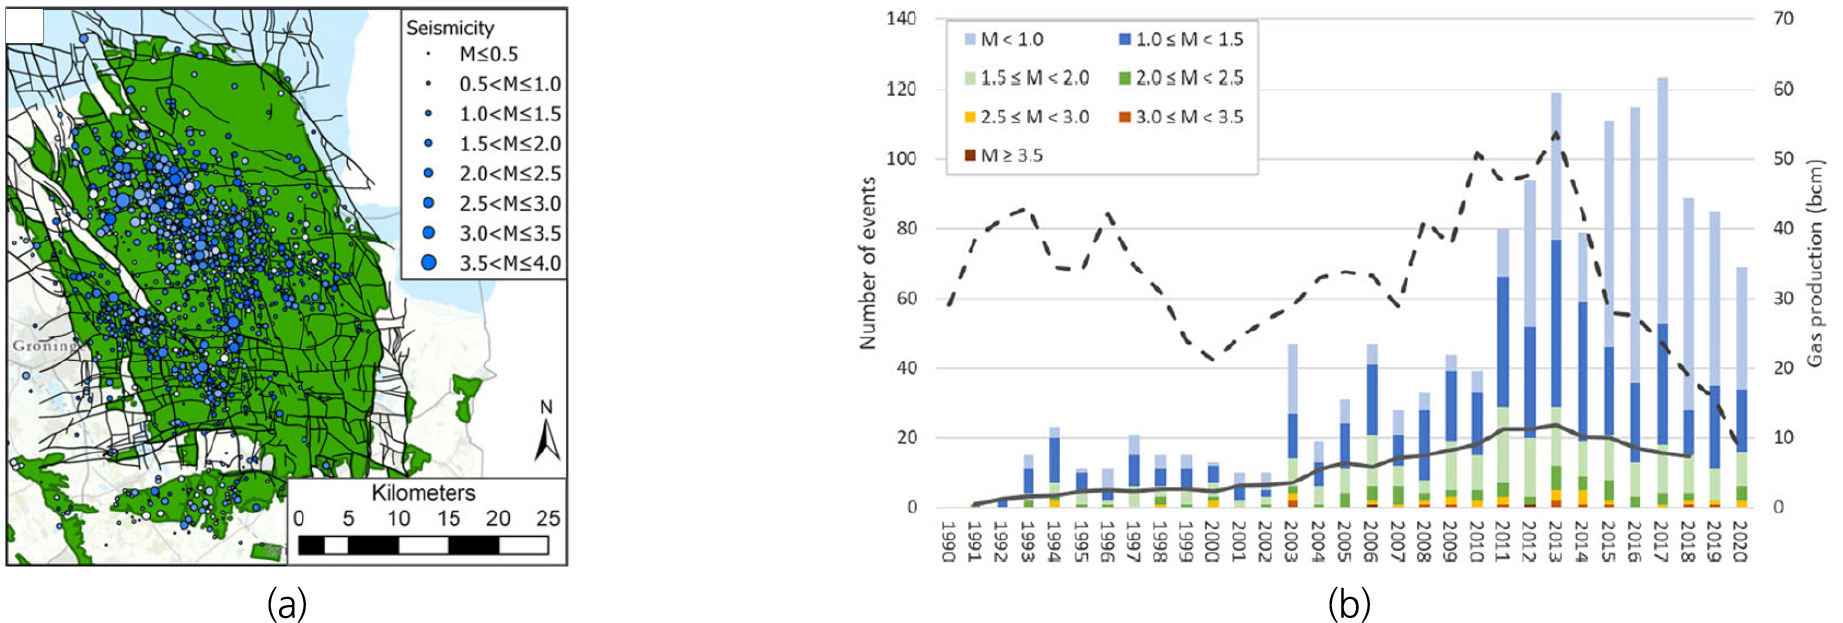
Fig. 1
(a) Map of earthquakes recorded by KNMI from 1960-2022, with marker size scaled to magnitude, (b) Plots of prduction history (production volume) and numbers of earthquakes during each year from 1990-2020 (Muntendam-Bos et al., 2022)
2. Groningen reservoir model with PFC2D
2.1 Model generation in 2D
Generation of a 2D Groningen gas field model using PFC2D was accomplished in several steps. Model generation first started with densely packing the (40 × 50) km2 sized model volume with rigid particles, of which the diameters range from 50 m to 60 m (following a uniform distribution), and unit thickness in the out-of-plane direction. The particle size was chosen by considering both computation efficiency and resolution of seismicity modelling. The complex fault system in the Groningen region as shown in Fig. 2 (a) (from Kortekaas and Jaarsma, 2017) was then overlain onto the particle assembly, and the particle contacts at the locations of the reservoir faults were replaced by the smooth joint contact model as shown in Fig. 2 (b). Fault traces were modeled at a consistent depth of 3 km, characteristic of the Groningen reservoir depth. Fault failure (smooth joint failure) was governed by the Mohr-Coulomb failure criterion. The smooth joint contact model is commonly used in PFC modelling to mimic geological discontinuities (Mas Ivars et al., 2011, Yoon et al., 2017), such as bedding planes, microcracks, joints, discrete fracture networks, and faults. The mechanical properties of the smooth joint contact model are listed in Table 1. After that, the hydro-mechanical coupling model and pore-network model were implemented. For details of the HM coupling algorithm and how it is implemented in a bonded particle assembly, we refer to Yoon et al. (2013, 2014). The model was initialized with the reservoir pressure distribution for the year 1960, where the reservoir formation pressure was assumed uniform with 35 MPa as shown in Fig. 2 (c).
Table 1.
Modelling paremeters
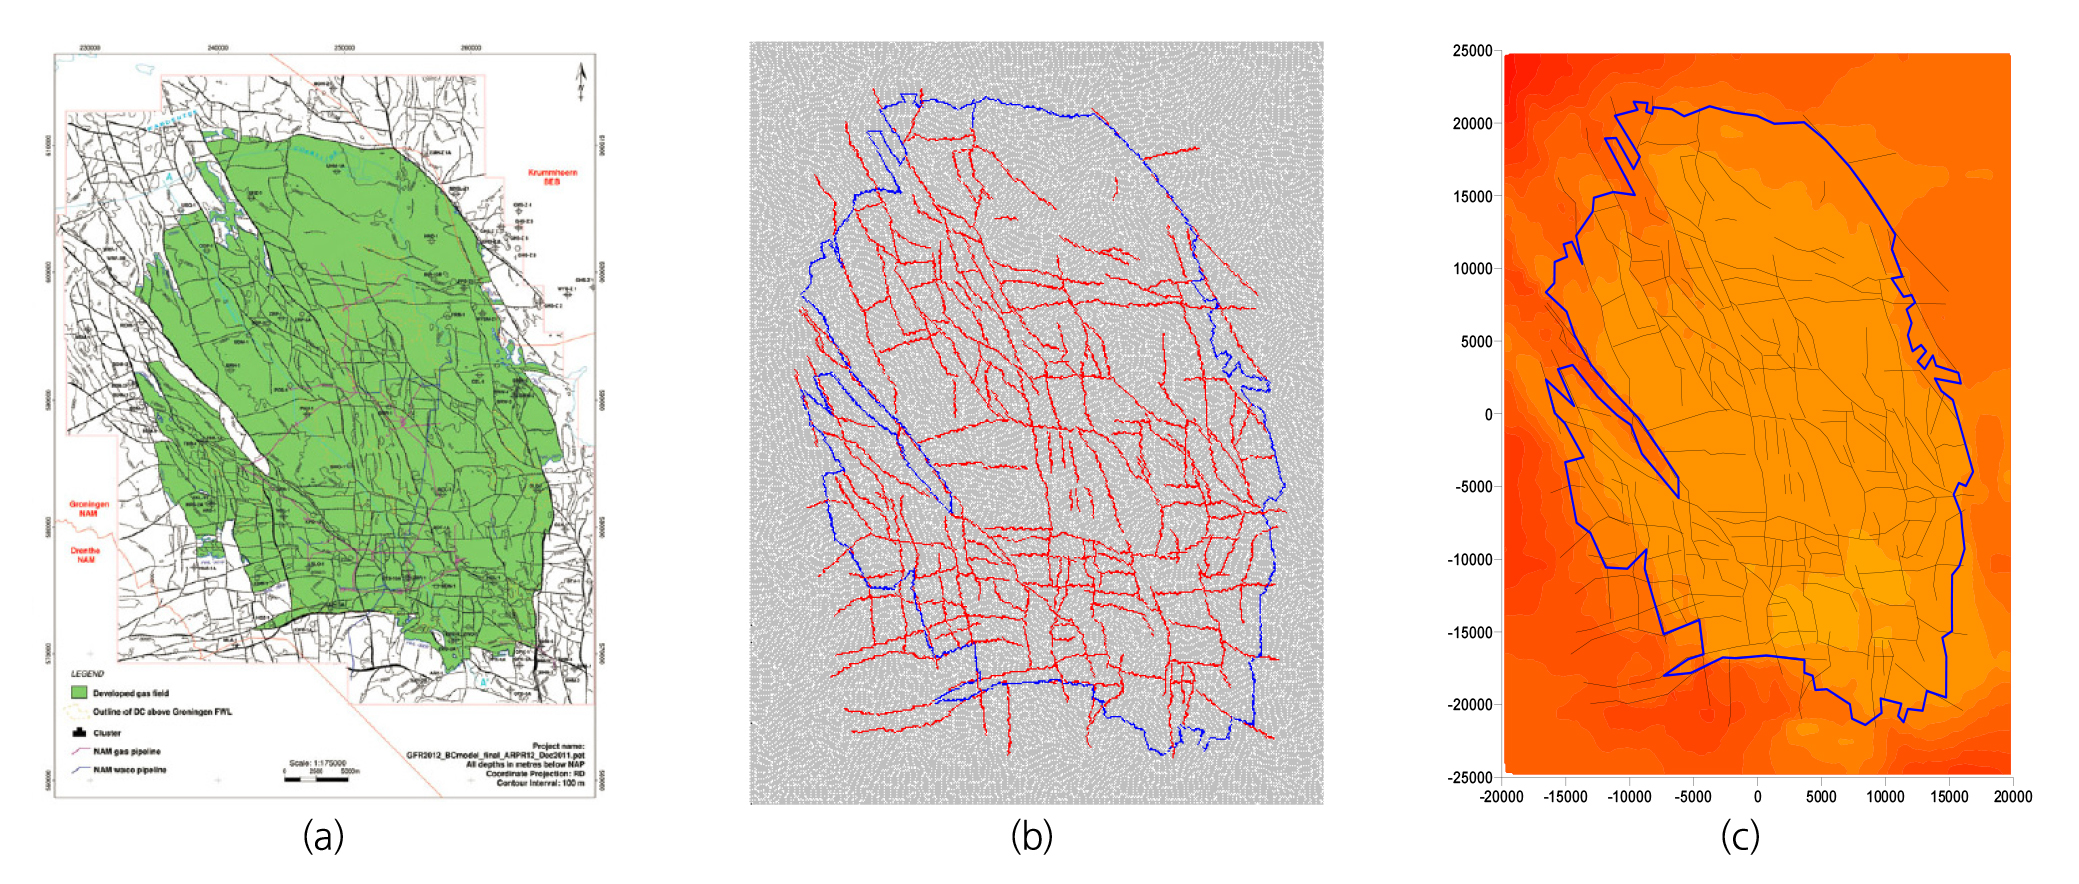
Fig. 2
(a) Reservoir fault model (Kortekaas and Jaarsma, 2017), (b) PFC2D model of Groningen reservoir, blue: impermeable reservoir boundary, red: reservoir faults, modelled by smooth joint contact model, (c) Reservoir pressure distribution at year 1960
Next, the model was imposed with an in-situ stress field. The assumed orientation of the maximum horizontal stress was N160°E (Guises et al., 2015), and the magnitudes of the maximum and the minimum horizontal stresses were 50 and 40 MPa, respectively. In PFC2D, we used a servo-controlled in-situ stress initialization model, where the velocities of the boundary layer particles were controlled so that the stress field measured inside the model matched the assumed orientation and magnitudes of the maximum and the minimum horizontal stresses. To monitor the stress field evolving inside the model, we used five local stress measurement circles (Yoon et al., 2012) as shown in Fig. 3 (a). The stress measurement circle logic in PFC was used to calculate the local stress field inside the measurement circles by averaging the stresses at the particle contacts that were confined within the designated measurement circles. In PFC2D, we assumed that the reservoir depth was 3 km and the vertical stress is 60 MPa. As the model was initialized with an anisotropic stress field (SH,max = 50 MPa and Sh,min = 40 MPa), there were smooth joint contacts already failing under the anisotropic in-situ stress field as shown in Fig. 3 (b). The mode I tensile failures of the smooth joints are denoted in blue and the mode II shear failures of the smooth joints are denoted in magenta. The model shown in Fig. 3 (b) is the starting model where the pressure depletion model is applied. A major assumption in this study is that the use of a 2D model, through PFC2D modeling, is considered valid due to its long horizontal extent, 40-50 km, and 200-300 m of net reservoir thickness (Fig. 3 (c)), i.e. similar to the thin-sheet model, where the top and bottom boundaries are assumed impermeable due to over- and underlying salt layers, and assumed plane-stress conditions. The use of a thin-sheet model to characterize the study region is supported by previous studies such as de Jager and Visser (2017).
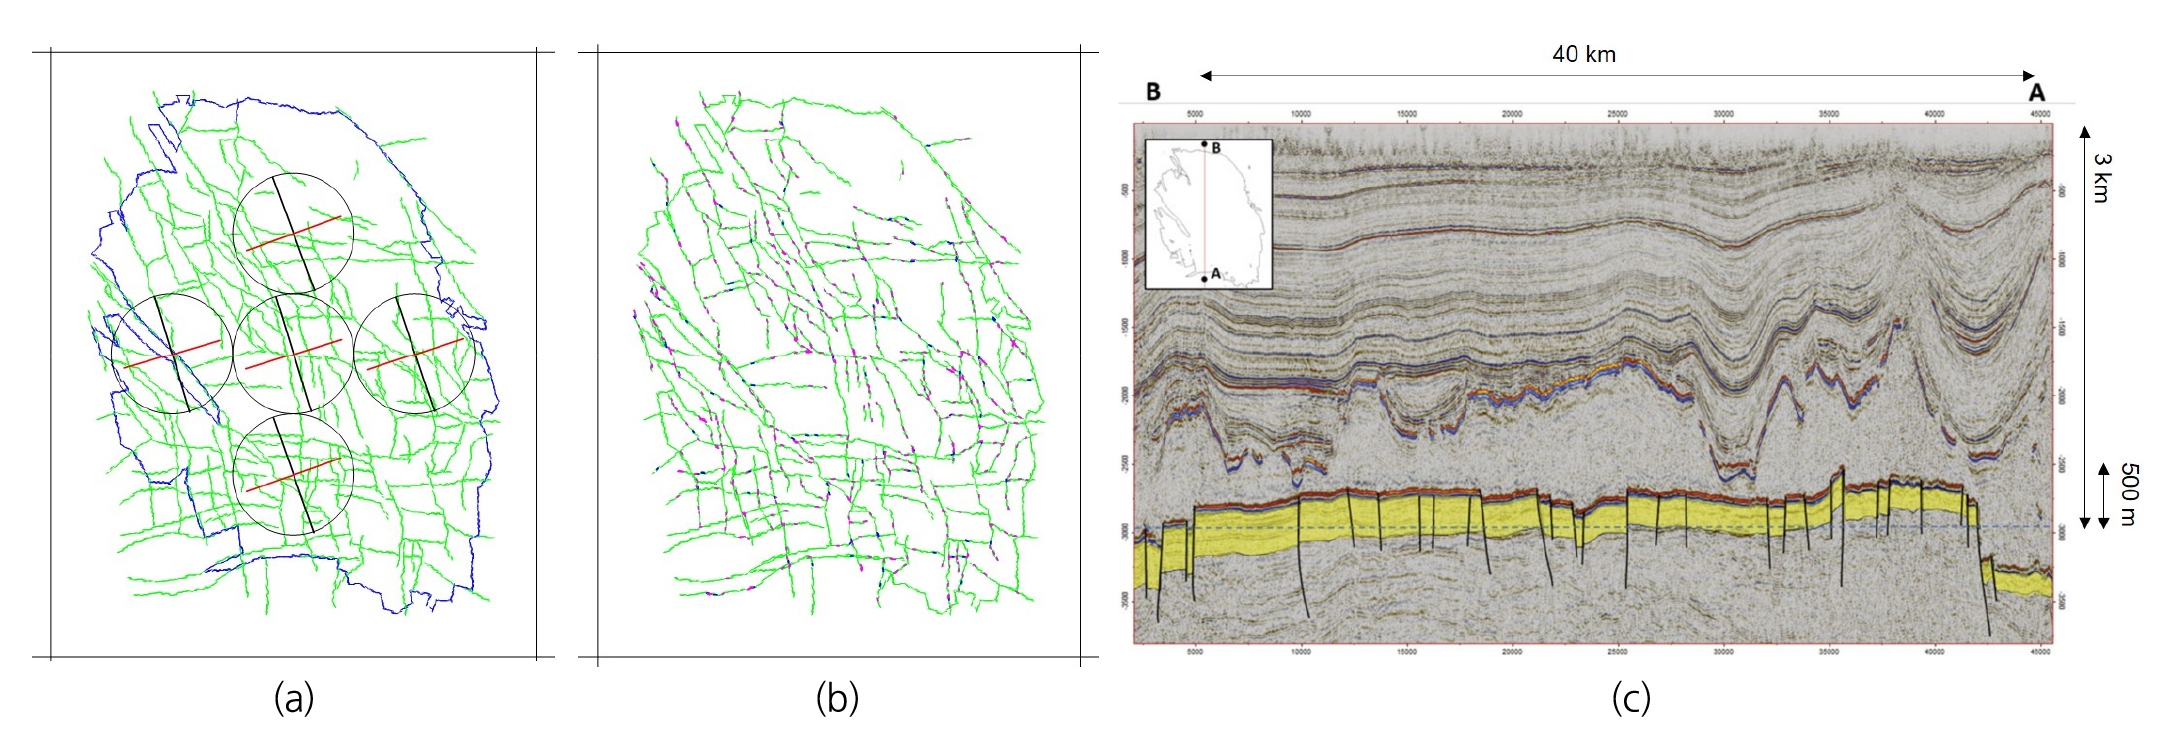
Fig. 3
(a) PFC2D Groningen reservoir model, where the in-sit stress field is initialized, (b) Distribution of smooth joint failures after applying anisotropic in-situ stress field, (c) North-south cross section of Groningen stratigraphy showing a clearly-delineated layer in yellow (de Jager and Visser, 2017)
2.2 Distribution of production clusters and pressure depletion
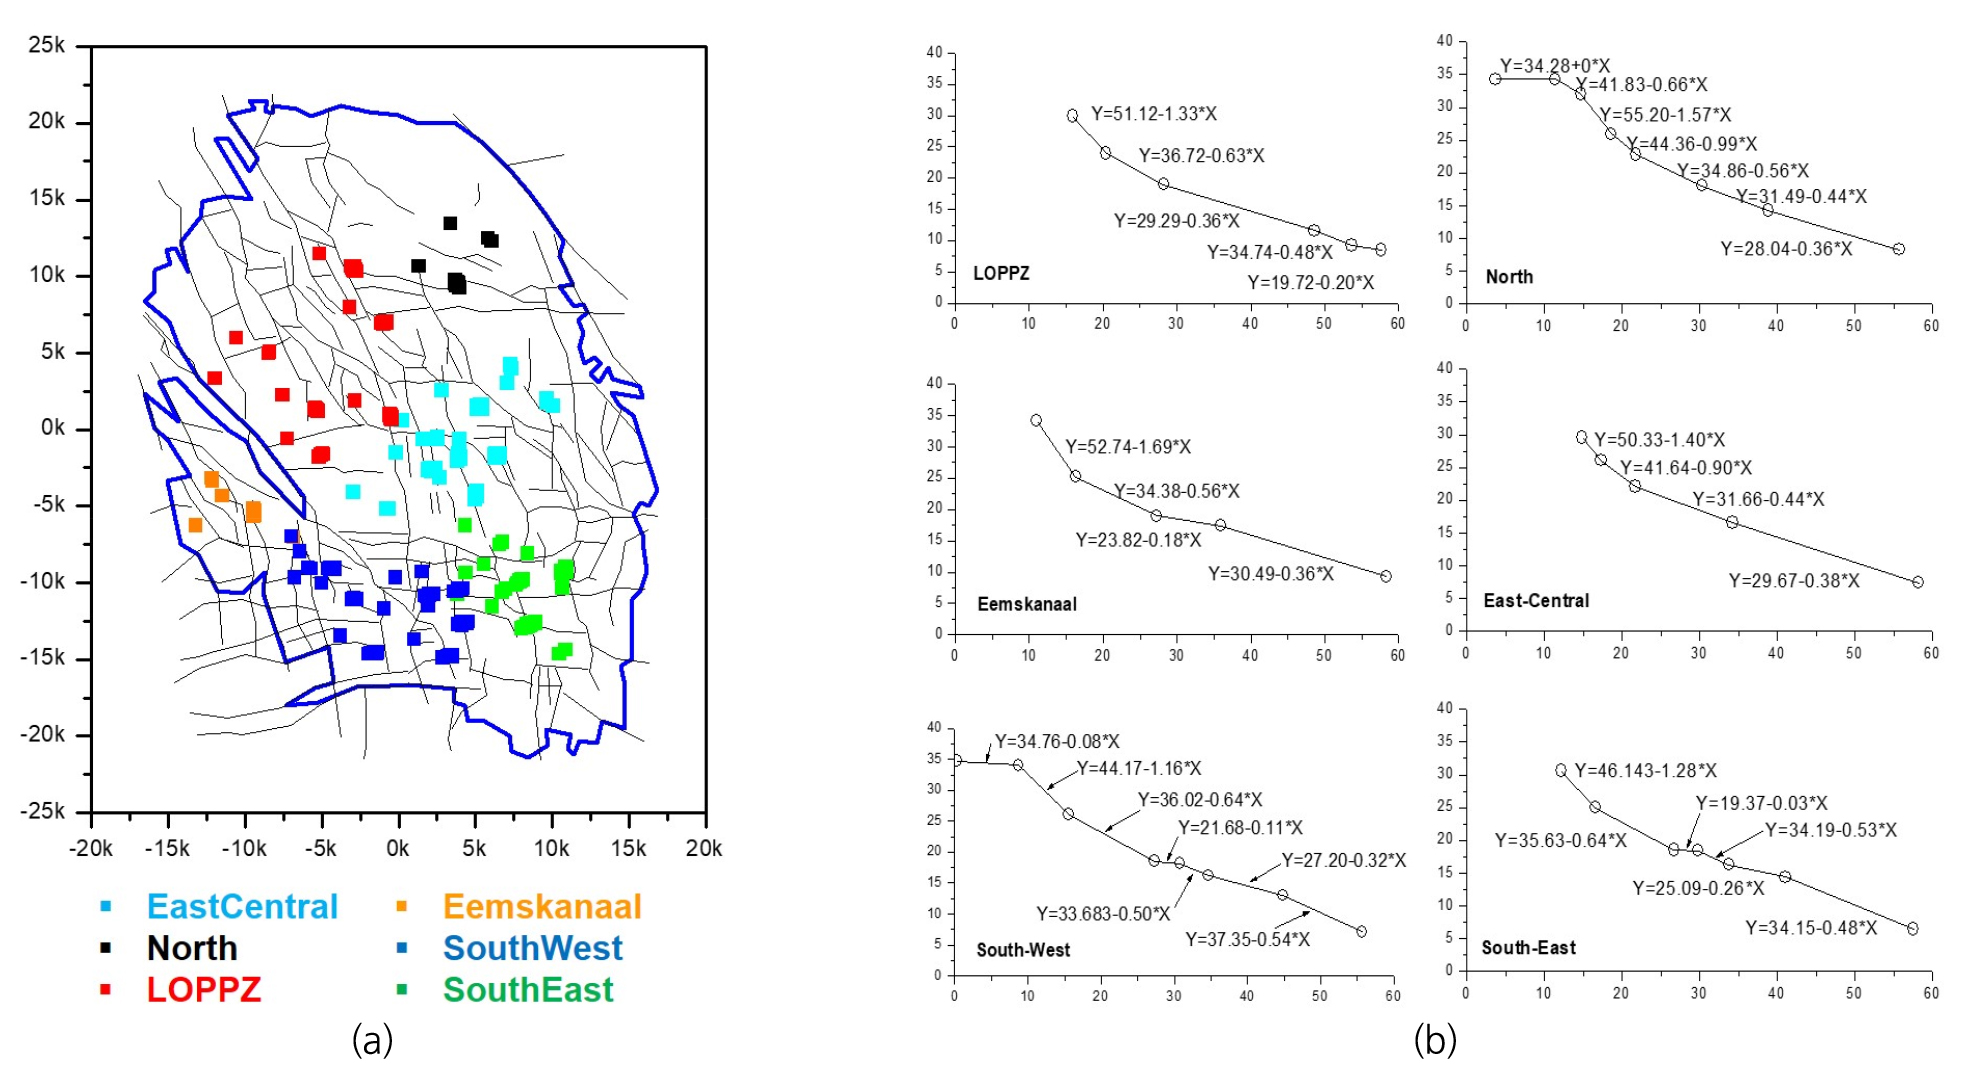
Pressure depletion was imposed on 385 wells, or pressure depletion points, shown in Fig. 4 (a). These wells were divided into six groups: East-Central (cyan dots), North (black dots), LOPPZ (Loppersum, red dots), Eemskanaal (yellow dots), South-West (blue dots), and South-East (green dots). For each group, pressure decline data from field measurement were represented by piecewise linear functions as shown in Fig. 4 (b). The piecewise linear functions then were programmed in PFC2D to be used as input in the depletion modelling. Depletion was simulated in the Groningen study region for 60 years from 1960.
3. Modelling depletion induced seismicity
3.1 Evolution of reservoir pressure and seismicity
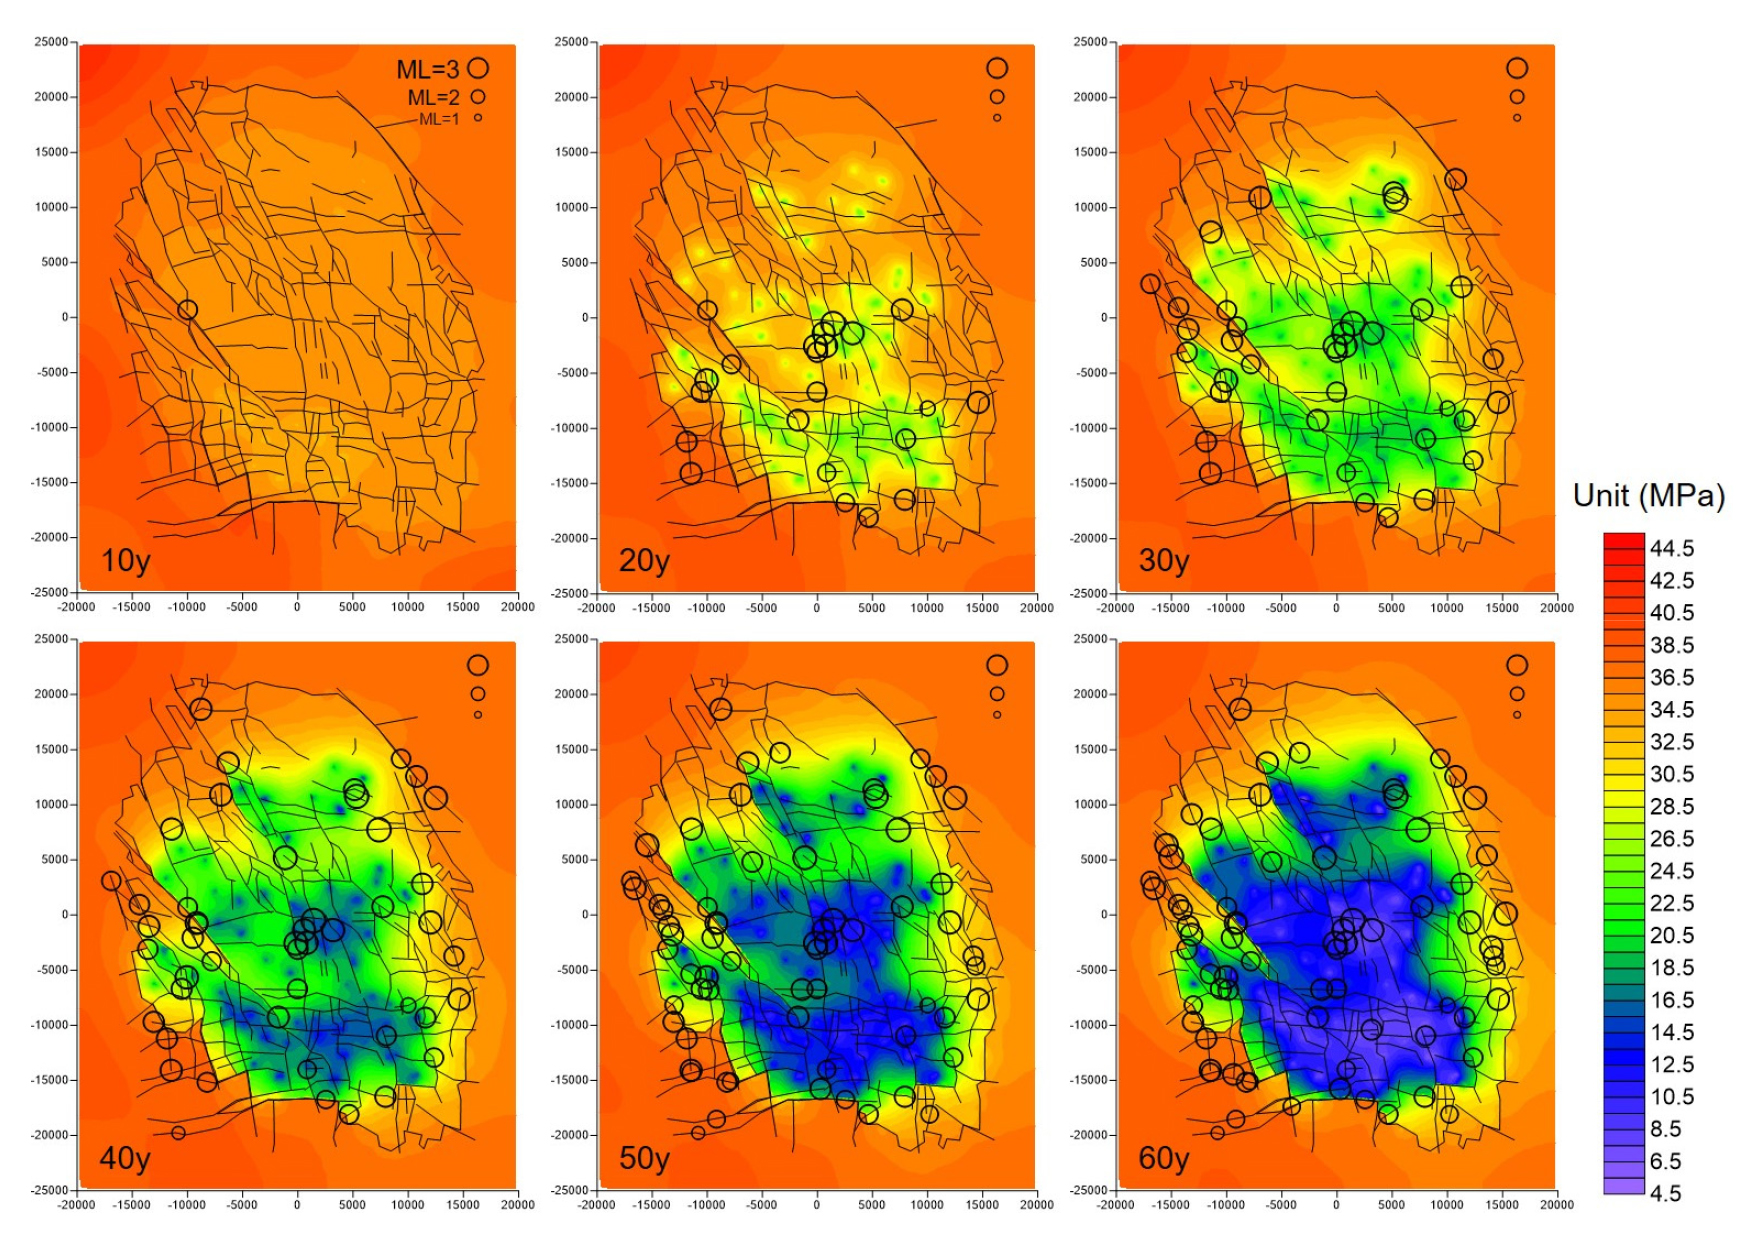
Simulated pressure and seismic event distributions during depletion are shown in Fig. 5. The figure shows pressure and seismicity evolution at 10-year intervals. We used the numerical moment tensor model in Yoon et al. (2014) to calculate seismic source parameters (seismic moment, moment magnitude) from bond failure. Pressure minima are generated by the model within the southern and central regions. Pressure depletion begins in the south of the reservoir, and the model demonstrates a good spatial correlation between the seismic events and the area of pressure depletion. During the 20 years of simulated depletion, a cluster of seismic events forms in the center of the reservoir. As the simulation progresses, seismicity generated by the model becomes more homogeneous over space, though a majority of events are generated near the eastern and western reservoir boundaries and within the central reservoir area. In total, 72 seismic events were generated during the depletion period. The lowest magnitude of the seismicity is ML1.1 and the largest magnitude of the seismicity is ML2.6.
3.2 Stress analysis
Changes in local maximum and minimum horizontal stresses after 60 years of pressure depletion are shown in Fig. 6. Within the centers of these regions, the maximum horizontal stress increased up to 12–14 MPa, with particularly large areas of increased stress in the south and southeastern regions of the Groningen reservoir. Minimum horizontal stresses increased primarily in the central and southeastern regions of the reservoir for both fault models, by up to 14 MPa. The figure demonstrates that the location of intense seismicity is spatially correlated with the location where the effective stresses show large increase. Fig. 7 shows changes in the local stresses represented by Mohr circles. Additionally, the figure shows that the stresses not only increase but also differential stress (σH – σh) increases, resulting in a larger size Mohr circle.
The most common type of faulting in the Groningen reservoir is normal faulting, where the effective vertical stress increase by the amount of reservoir pressure drop is large, while the amount of effective horizontal stress increase is smaller than reservoir pressure drop due to the confined horizontal reservoir. Such a stress change causes an enlarged Mohr circle, and eventually satisfies the Mohr-Coulomb failure criterion of the fault. Although this model is in 2D and does not contain the vertical stress component, the Mohr circle transition shown in Fig. 7 demonstrates to some extent the mechanism of faulting in a depleting reservoir. One can expect that the location of large horizontal stress increase would show an even larger increase in the vertical stress, as shown by the estimated Mohr circles in Fig. 7. In such a stress evolution scenario, there is a higher chance of faults to fail. The model being in 2D clearly has limitations, and is not capable of modelling seismicity through normal faulting. This may also be the reason for a lower number of simulated seismic events and smaller magnitudes compared to the field-observed seismicity.
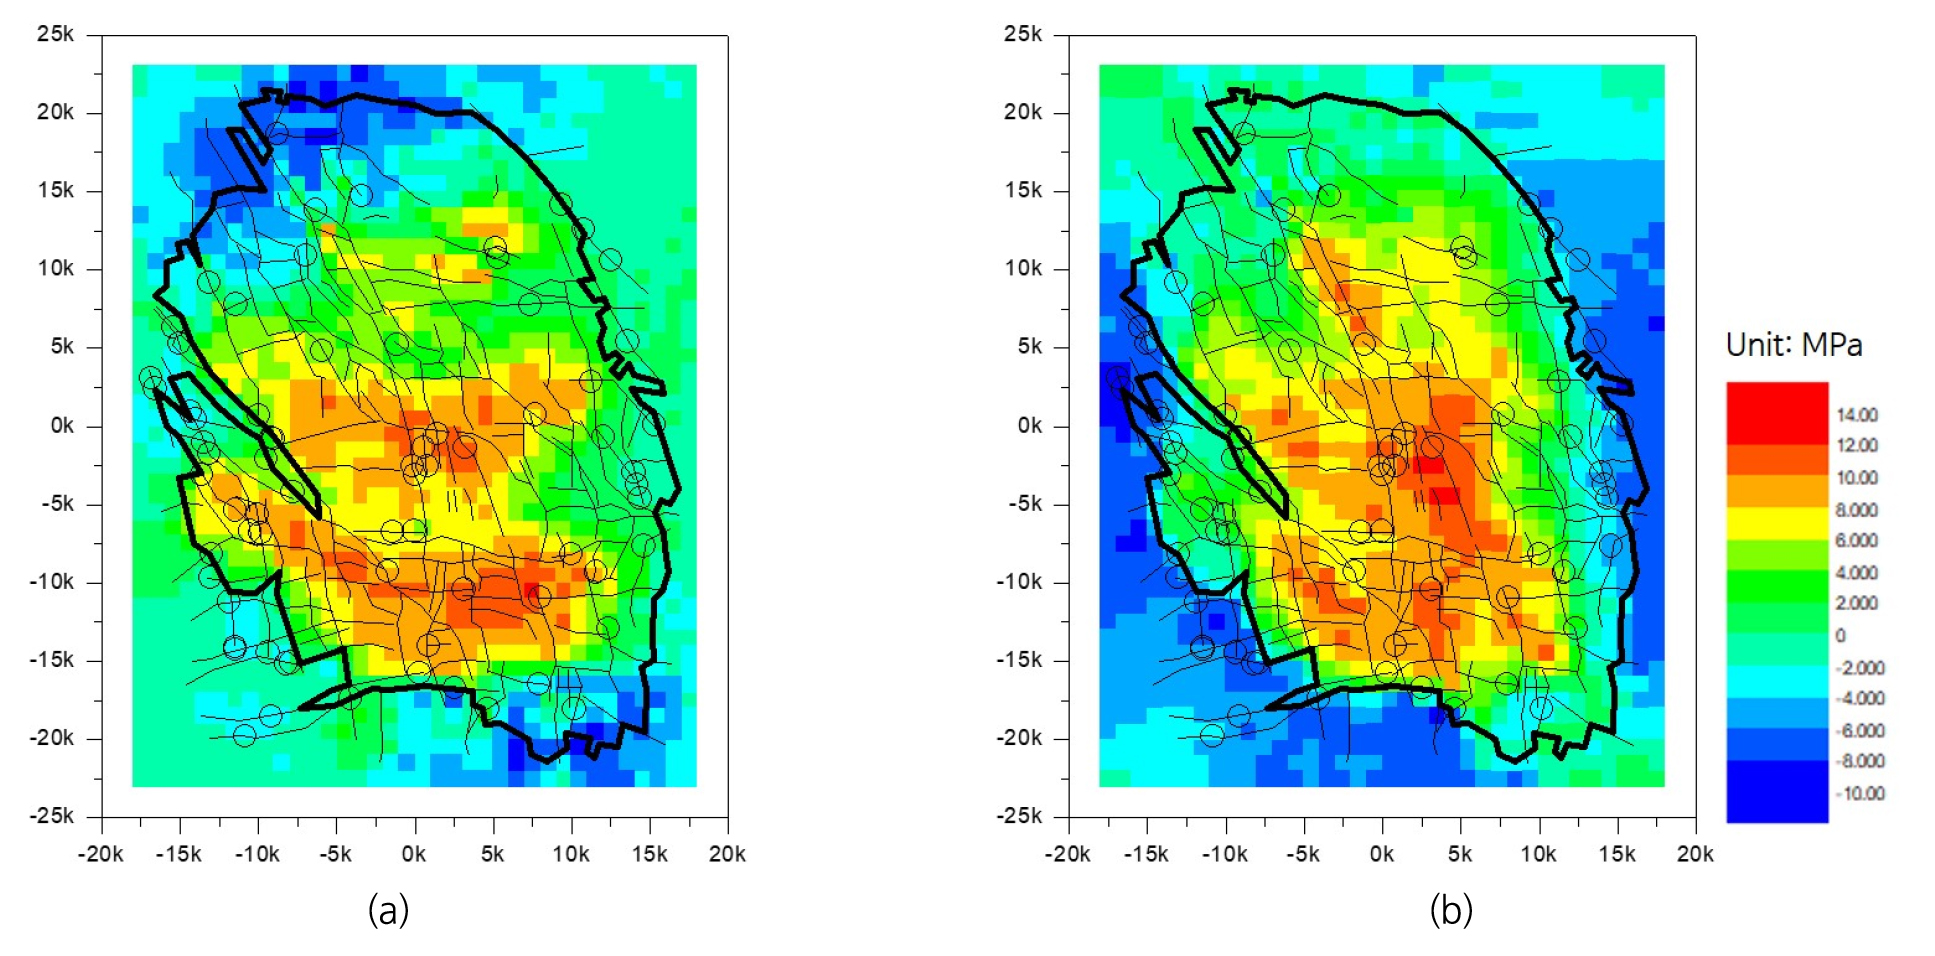
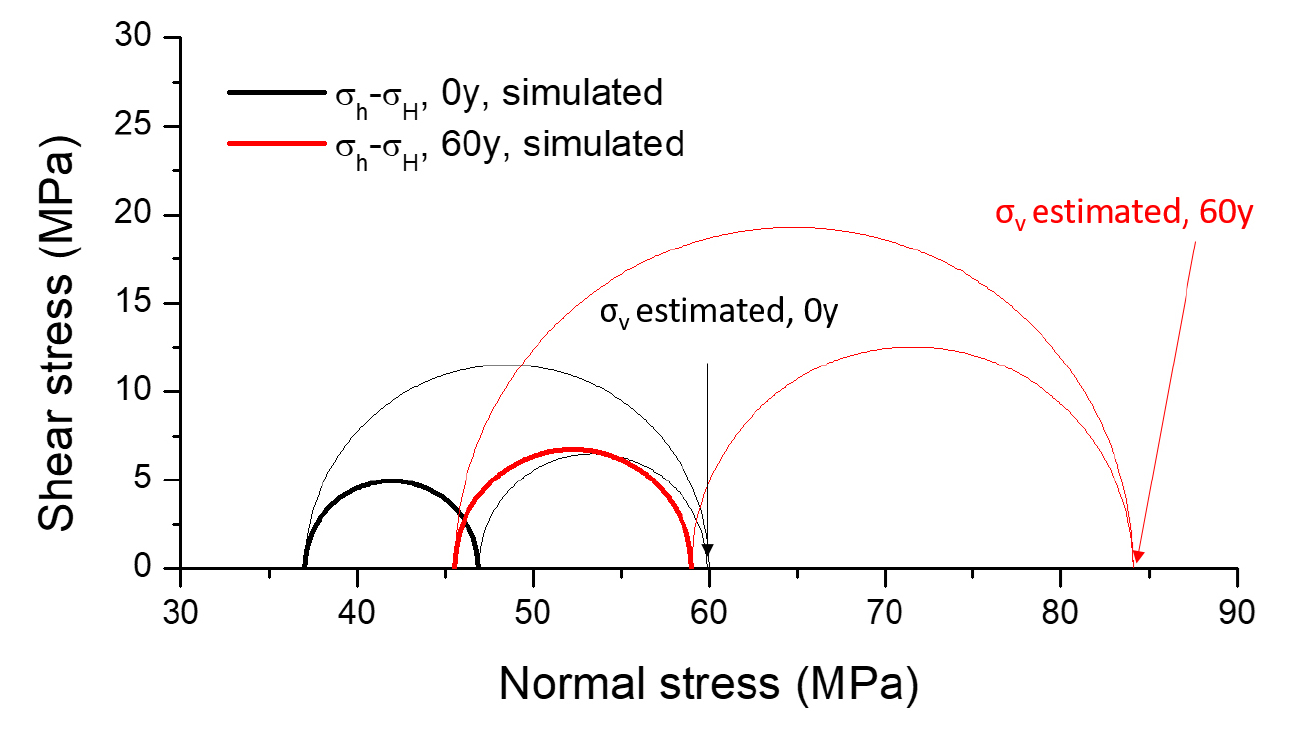
Fig. 7
Changes in the local stresses represented by Mohr stress circles. The two bold Mohr circles represent the σh-σH relations simulated before gas production (time = 0 year) and after gas production (time = 60 years). The rest of the thin Mohr circles represent the σH-σv, σh-σv relations. Note that the two values of σv are estimated
3.3 Compaction and subsidence analysis
We estimated reservoir compaction using equation (1). The reservoir thickness (∆h) is shown in Fig. 8 (a), which shows that the net thickness of the reservoir increases from southeast to northwest. This spatially varying reservoir thickness is used as input in equation (1) to estimate the spatially varying reservoir compaction. We estimated subsidence at the surface using equation (2), assuming a homogeneous elastic half-space and a disc-shaped reservoir seated at depth c with outer radius R. We used c = 3000 m, R = 15000 m, Poisson ratio v = 0.40 (Zechstein salt rock overburden). The resulting figure of subsidence distribution is shown in Fig. 8 (b). The simulation resulted in large subsidence at the middle part of the reservoir with a maximum magnitude of 40 cm, which matches fairly well with the field measurements shown in Fig. 8 (c) and 8 (d) (NAM, 2021).
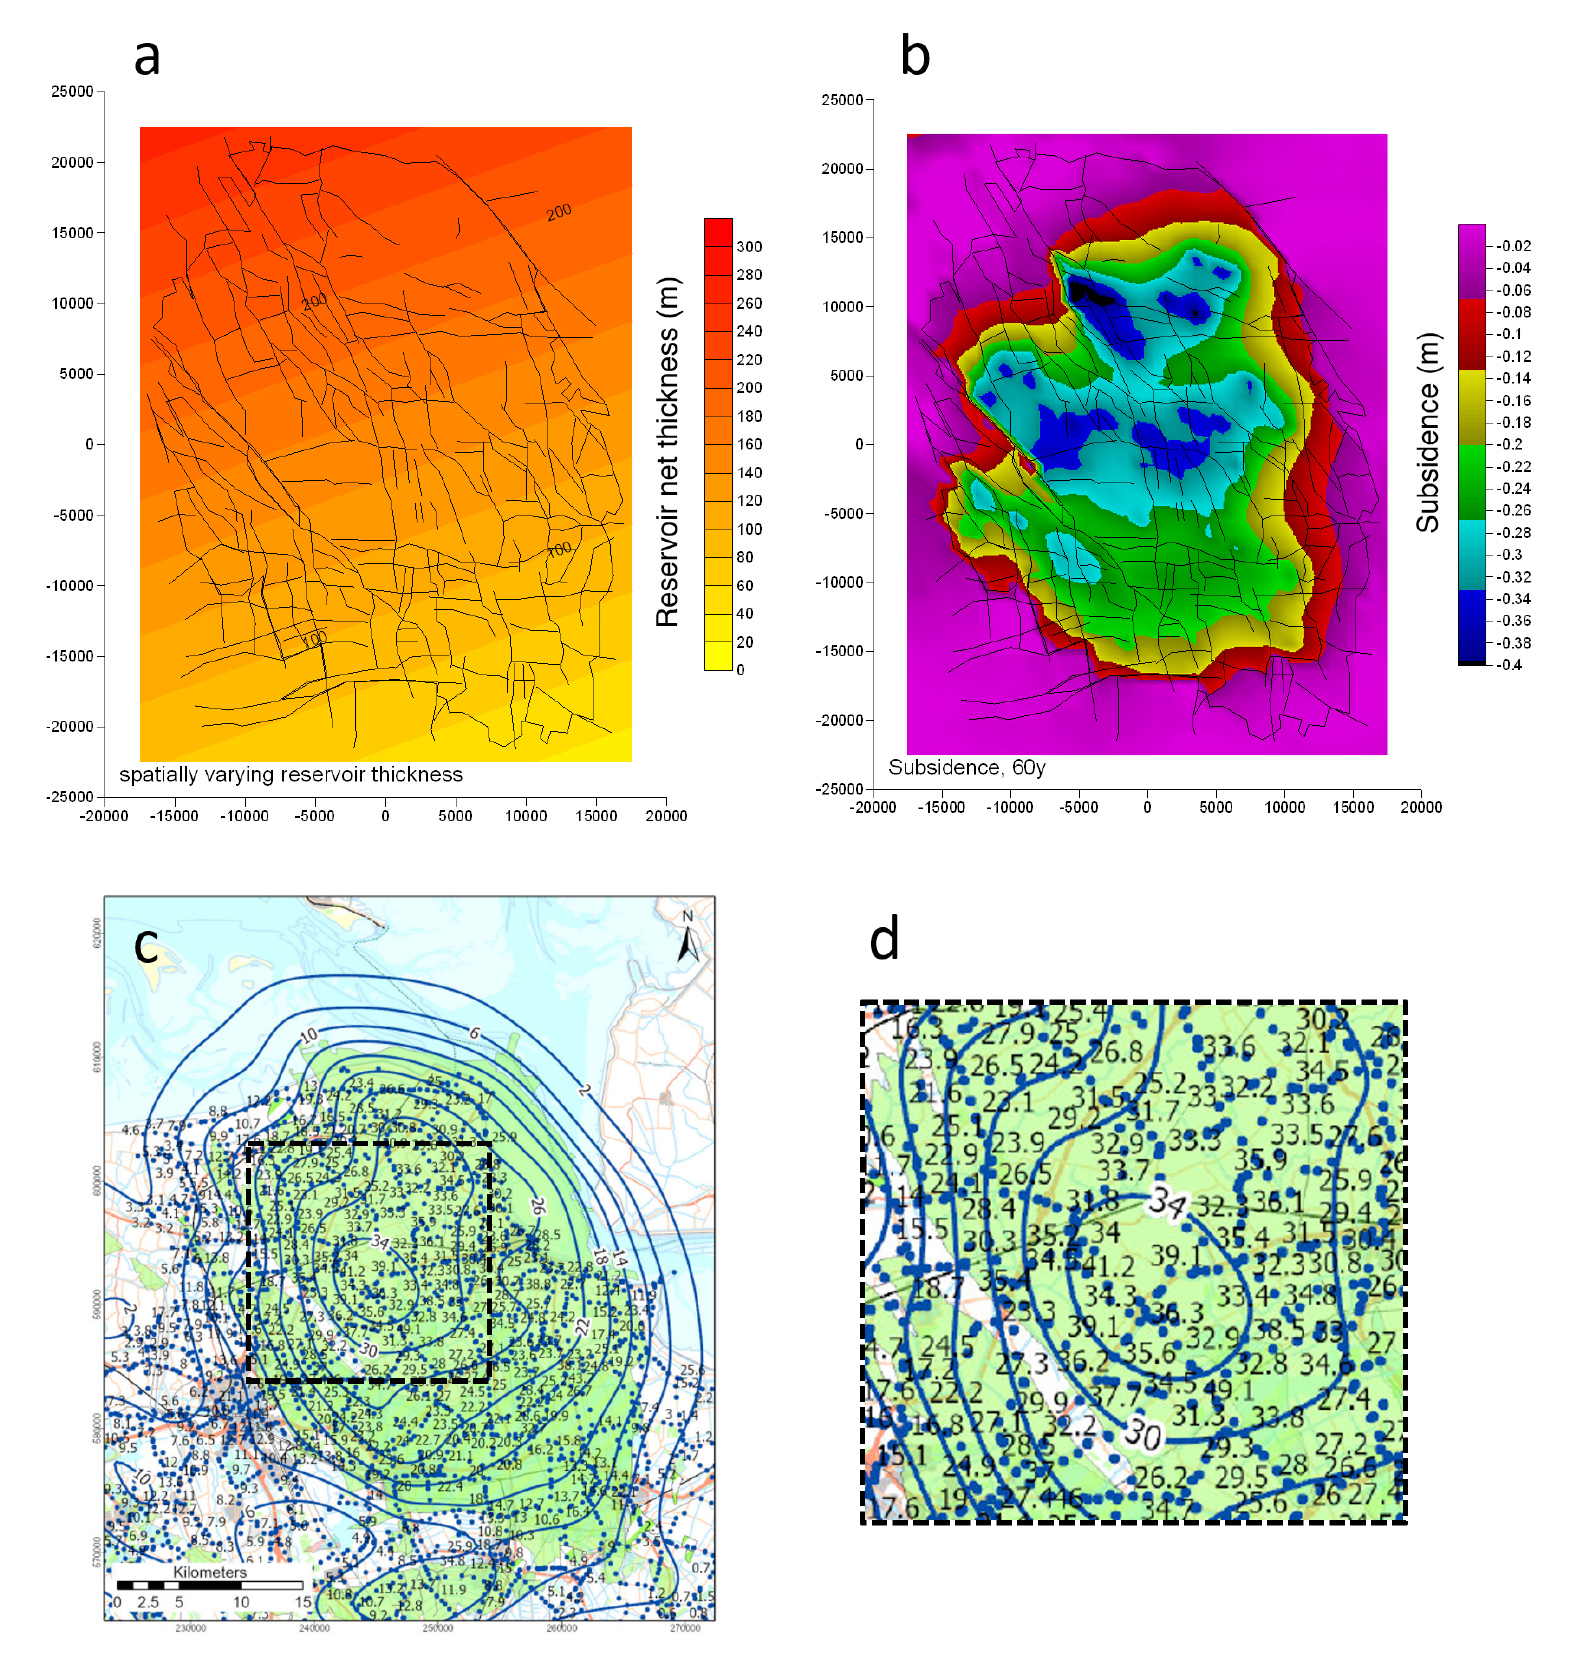
Fig. 8
(a) Spatially varying reservoir thickness, (b) Simulated spatially varying subsidence distribution estimated by reservoir compaction and subsidence calculation, (c) Field measurement of subsidence in the Groningen gas field and (d) Zoomed-in view at the middle part of the reservoir (subsidence measurements are all in cm)
4. Summary and conclusions
The modelling code used in this study is PFC2D (Particle Flow Code 2D), a commercial code of ITASCA, with in-house-developed hydro-mechanical coupled and seismicity computing models. We modelled the entire field of the Groningen gas reservoir with a size of (40 × 50) km2 and containing complex reservoir faults. The model is in 2D, which we considered valid due to its long horizontal extent (40-50 km) compared to the net thickness of the reservoir (200-300 m), similar to the thin-sheet model in other studies. We built the model with highly complex geometry of the reservoir fault using the smooth joint contact model in PFC2D. Evolution of the reservoir pressure and seismicity in the Groningen gas reservoir was simulated using the approximated production cluster well pressure decline data.
The overall objective of this study was to predict future seismicity after the years 2020-2022, when the gas production is supposed to end due to continuing seismicity in Groningen. In order to predict the future seismicity using numerical modelling, first we simulated the current state of the reservoir by reproducing the past 60 years of depletion-induced seismicity that covers the time range from 1960 to 2020. During the 60 year depletion period, the greatest pressure decline was simulated within the East-Central and South regions. The modelled seismicity was largely concentrated along the reservoir boundary due to escalated pressure differences between the inner and outer parts of the reservoir due to the impermeable boundary. The Groningen gas reservoir boundary is considered impermeable, and in particular it is reported that the north part of the reservoir is in contact with water, which acts as a strong hydraulic barrier for gas migration. The rest of the reservoir boundary is a mixed form of hydraulic barrier and conduit. Due to its high uncertainty, such a mixed form of the hydraulic barrier/conduit boundary condition was challenging to implement. Therefore, as a conservative approach, we imposed an impermeable boundary condition on the reservoir boundary by assigning a low hydraulic aperture to the flow channel along the reservoir boundary. The model can be improved by imposing an inhomogeneous hydraulic boundary condition, which is considered as a possible approach to improve the seismicity distribution matching between the model and the field observations. The distribution of seismicity near the western reservoir boundary was partially consistent with KNMI earthquake-catalog data, though considerably fewer earthquakes were generated from the PFC2D simulations than what was observed in the field. Ultimately, the depletion model adequately captured the spatial distribution of observed earthquakes above local magnitude 2.0, rendering their spatial seismicity distributions consistent with that of KNMI earthquake-catalog data. Reservoir compaction and subsidence at the surface were estimated by the spatially varying reservoir pressure distribution after 60 years of depletion. Our simulation results demonstrate that, although we approximated the complex 3D system as a 2D thin-sheet model, surface subsidence distribution matches fairly well with the field measurement. We conclude that, despite the dimensionality difference, approximted well pressure decline data, uncertainty in the reservoir permeability, reservoir fault geomechanical parameters, and in-situ stress field, the presented modelling method can reasonably simulate gas production induced seismicity in a gas reservoir with a complex fault system.
