

1. INTRODUCTION
2. MATERIALS AND METHODS
2.1 Sample preparation, testing cell and X-ray CT equipment
2.2 Testing setup and limitations
3. RESULTS
3.1 X-ray CT histograms at different testing times
3.2 X-ray CT results along the sample height
3.3 Formation and evolution of cracks and voids
4. CONCLUSIONS
1. INTRODUCTION
Engineered Barrier System (EBS) for deep geological disposal of high-level radioactive waste are composed of a canister for the spent nuclear fuel, backfill, buffer, and gap-filling materials (Booker et al., 2004, Ewing et al., 2016). Multiple small disposal wells are drilled from the disposal tunnel. The buffer material is used to fill out the space between the canister and the disposal well, while the backfill material fills out the main disposal tunnel. The purpose of placing a buffer material is not only to cover the space between the rock and the canister, but also to block the discharge of radionuclides physically, chemically, hydraulically, and biologically. Similarly, the backfill material is meant to isolate the EBS, and stabilize the area.
Given these conditions, various studies have assessed the usage of bentonite as a buffer and backfill material. Xu et al. (2016) investigated the thermo-hydro-mechanical properties of compacted mixtures of sand and GMZ01 bentonite to be used as buffer material. They measured the swelling pressure, hydraulic and thermal conductivity, and found out that the sand content play an important role on increasing the hydraulic conductivity. Similarly, Liu et al. (2021) evaluated mixtures of powder and pellets using GMZ bentonite. Their results showed that upon 71 hours of hydration, that the swelling pressure of blocks made of bentonite only increased faster and achieved a higher peak value than mixtures of powder and pellets. Based on this observations, they proposed a new theory to explain the slower reaction process in mixtures of pellets and powder, which is based on the concepts of accumulated and dissipated wedging pressures.
In South Korea, previous studies have evaluated the use of Ca-bentonite from Gyeongju as buffer and backfill material (Yoon et al., 2018). Yoo et al. (2016) analyzed the physical and chemical properties of Gyeongju bentonite, and reported an optimum water content of 10.96%. On the other hand, Park et al. (2021) assessed the dry and saturated behavior of Gyeongju bentonite under thermal effects and pointed out that temperature induced volume contraction and permeability changes. In fact, the hydraulic gradient was clearly affected by thermal effects, showing a linear increase with temperature.
X-ray computed tomography (CT) has been extensively used to characterize constructions materials as well as mixtures of bentonite pellets and powder (Diaz et al., 2021). For example, Molinero-Guerra et al. (2017) analyzed MX80 bentonite in the form of pellets, as well as mixtures of pellets and powder. Their analysis aided to observe the inner structure of bentonite pellets, where small fractures and voids were often encountered. Similarly, Saba et al. (2014) estimated the porosity based on CT images of mixtures of bentonite powder and crushed pellets. By dividing the sample cross section into smaller sub-regions, they were able to determine the changes in porosity for different directions along the cross section. Recently, Chang et al. (2021) compared the behavior of two cylindrical samples under hydration only and hydration and thermal conditions using a medical CT scanner. Their results showed how the heated sample presented a slight density decreased interpreted by the authors as a direct effect of the mobilization and accumulation of bentonite near the heating source located in the middle of the sample.
As a way to continue the national efforts on the characterization of different local materials, we developed a hydration cell to test multiple combinations of bentonite materials. The cell is constructed of plastic and mounted on an aluminum frame. Both, the cell and frame materials were selected to facilitate CT scanning during testing. Then, it is important to evaluate the performace of the cell as well as the posibility of applying X-ray CT technology during testing.
This study presents an assessment on the feasibility of applying X-ray CT technology on the characterization of bentonite upon hydration inside a newly developed testing cell. The cylindrical cell was made of transparent plastic, and sits inside an aluminum frame. CT scannings are carried out before and after hydration, to inspect the state and quantify the changes every 24 hours after the test onset. CT histograms based on nearly the entire volume of the sample and CT profiles are also computed to analyze the overall evolution of the sample, as well as the detail changes along the sample height. The results are discuss in detail and compared with previous publications, along with considerations for future works.
2. MATERIALS AND METHODS
2.1 Sample preparation, testing cell and X-ray CT equipment
The hydration test was carried out with a cylindrical sample of Gyeongju bentonite. The sample was prepared with powder bentonite at a target dry density of 1.4 g/cm3, and a water content of 20%. The final dimensions of the sample are 27.5 mm in diameter and 34 mm in height. On the other hand, the testing cell is constructed of transparent plastic, with a removable cap (Fig. 1(a)). To ease the measurement of vertical displacements, water is injected at the bottom and collected at the top of the cell. After assemble, the cell is set under an aluminum frame, from where vertical displacement or pressure can be measured. Moreover, the bottom and top cap have small indentations of 2.7 mm in depth that are meant to distribute and collect the water flow, and they are shown in the schematic vertical section of the cell in Fig. 1(b). These indentations influenced the bentonite swelling behavior, and the specific effects are shown and discussed later. The hydration test was monitored at different times using the X-ray CT equipment at Korea Maritime and Ocean University (Fig. 1(c)). The hydration experiment was conducted outside the cell and halted every 24 hours. for CT inspection. To reduce the disturbance of the sample while moving it from the testing table to the CT chamber, the cell and aluminum frame were transported using a rotating table. The sample was scanned under the following conditions: source-object distance, 140 mm; voltage, 160 kV; current, 70 µA; exposure time, 0.3 s; 2700 projections; and pixel size, 0.0550140 mm.
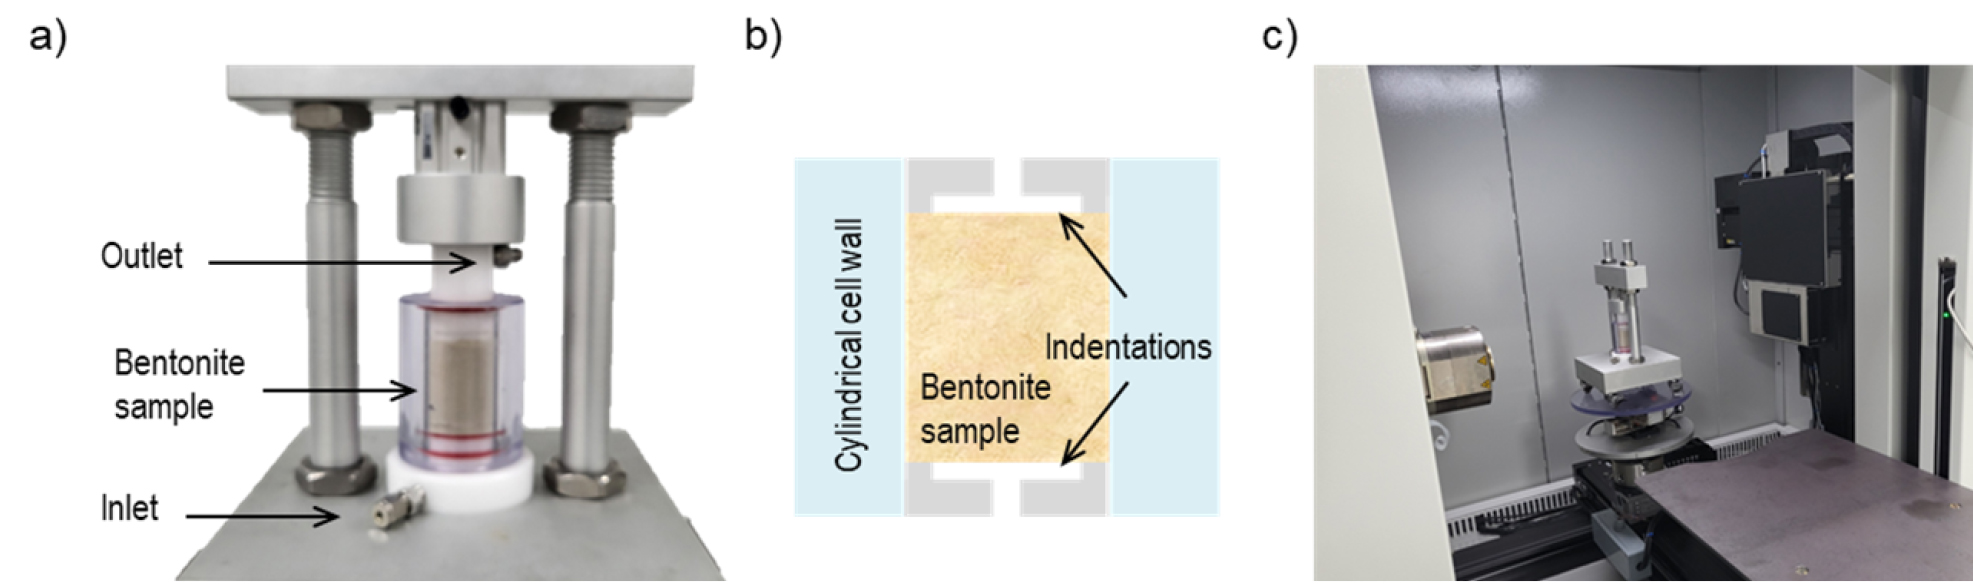
Fig. 1.
a) Testing cell with bentonite sample. Water was injected from the bottom and collected at the top of the sample. b) Schematic of a central vertical section of the hydration cell. c) Testing cell inside X-ray CT equipment for scanning. The cell is transported and placed inside the CT chamber using a moving table
2.2 Testing setup and limitations
The hydration test using Gyeongju bentonite was carried out under a constant water pressure of 0.207 MPa (30 psi), at room temperature and lasted for seven days. A constant pressure was selected to simulate groundwater pressure conditions. To monitor the condition and evolution of the cylindrical bentonite sample upon hydration, the sample was scanned before testing and every 24 hours from the test onset until its end. No swelling pressure was recorded.
The CT inspection before hydration revealed that fragments of the sampled detached from the top, after assemble (Fig. 2). After preparation, the sample was not kept under sealed conditions, and therefore it dried out at room temperature. This, along with the shape of the cap indentation may have influenced the fragmentation observed at the top of the sample. Moreover, the CT scanning after one day of hydration showed how the sample swelled and filled out the indentations at the bottom and top cap. At the same time, small cracks were observed at the bottom of the sample. These shortcomings during the sample preparation and testing have important effects on the recorded bentonite behavior. However, since this preliminary test is meant to evaluate the applicability of X-ray CT technology on the characterization of bentonite under hydration, we selected different volumes for the states before and after hydration. For the CT analysis before hydration, a smaller volume of 27 mm in diameter and 23 mm in height was selected as indicated with red dashed lines in Fig. 2. On the other hand, for the CT analysis after hydration, the selected volume was larger, and aimed to cover nearly the entire size of the sample with a diameter of 27 mm and a height of 33 mm (Fig. 2).
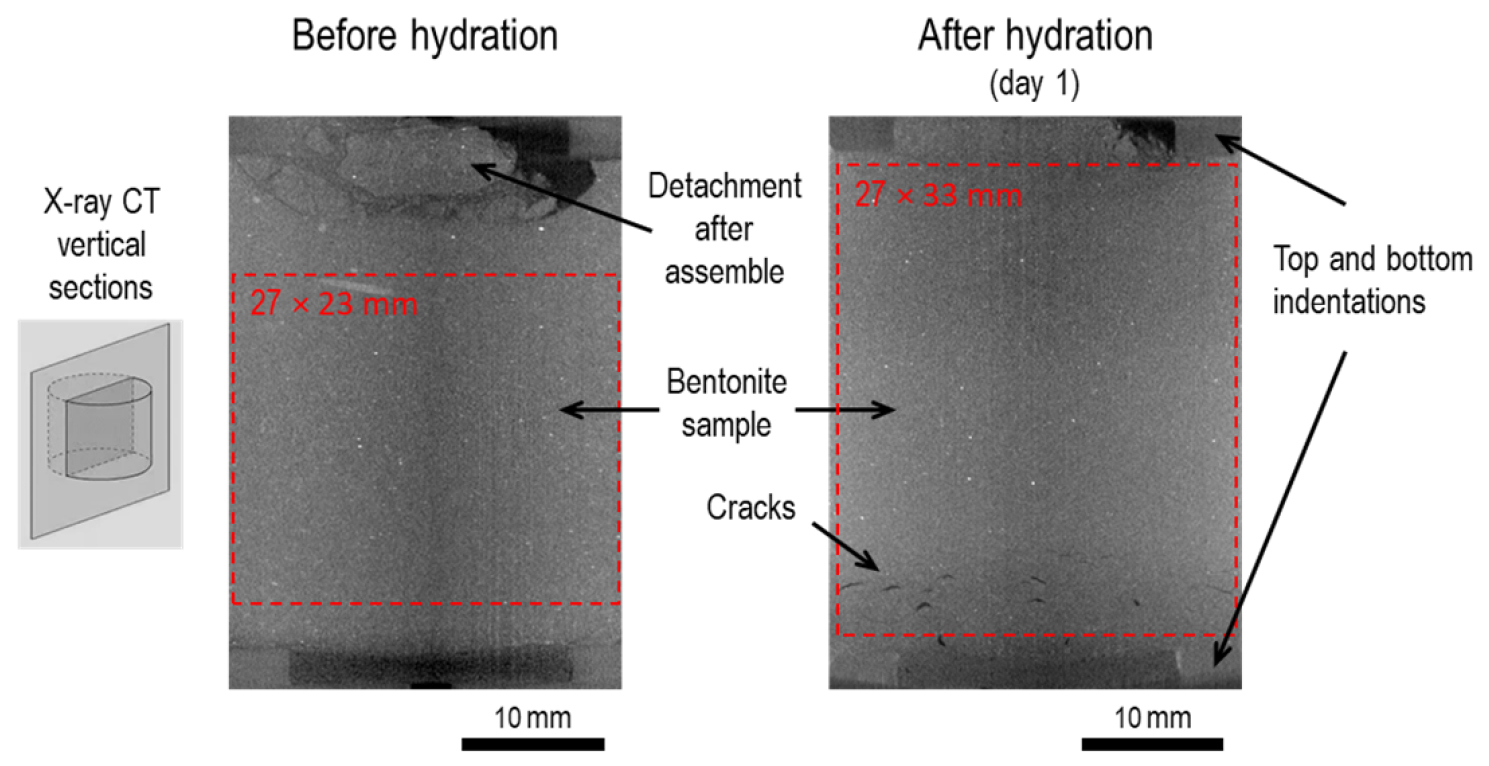
Fig. 2.
Vertical CT sections of the bentonite sample before and after one day of hydration. The CT section before hydration shows detachment of fragments at the top of the sample. Moreover, after one day of hydration, the sample swelled and filled out the indentations at the bottom and top cap. The selected volumes for CT analysis (red dashed lines) before and after hydration were different. A diameter of 27 mm and a height of 23 mm were set for the CT analysis of the sample before hydration, while the dimensions were 27 mm in diameter and 33 mm in height for the inspected region after hydration at different times
3. RESULTS
3.1 X-ray CT histograms at different testing times
The X-ray CT intensity distribution curves or histograms of the sample at different times are shown in Fig. 3. The frequency is plotted against the full range of CT values (0 – 255) in Fig. 3(a). The CT value represents the attenuation of the X-ray beam per unit of volume. Then, dense materials appear on the higher end of the CT value range because X-ray beams are attenuated the most when passing through such medium, while loose or thin materials appear on the lower end. The mean values (µ) or CT values corresponding to the peak frequency for each measurement are also included. The histograms show how the hydration process induced an initial increase and later decrease on the mean CT values. Moreover, the extent of the histograms also increased and decreased. Fig. 3(b) compares the histograms before and after one day of hydration. The mean CT value and the histogram full width at half maximum (FWHM) increased after hydration. At the end of testing, the mean CT value and the FWHM decreased, with values close to those of the original state (Fig. 3(c)). However, the lower edge of the histograms was similar throughout the measurements. This similar value of the lower edge, but increase on the extent of the histograms mean that the changes induced by the hydration process mostly increased and decreased the density of the sample above the original state. In other words, the amount of density reduction below the initial state due to hydration was small.
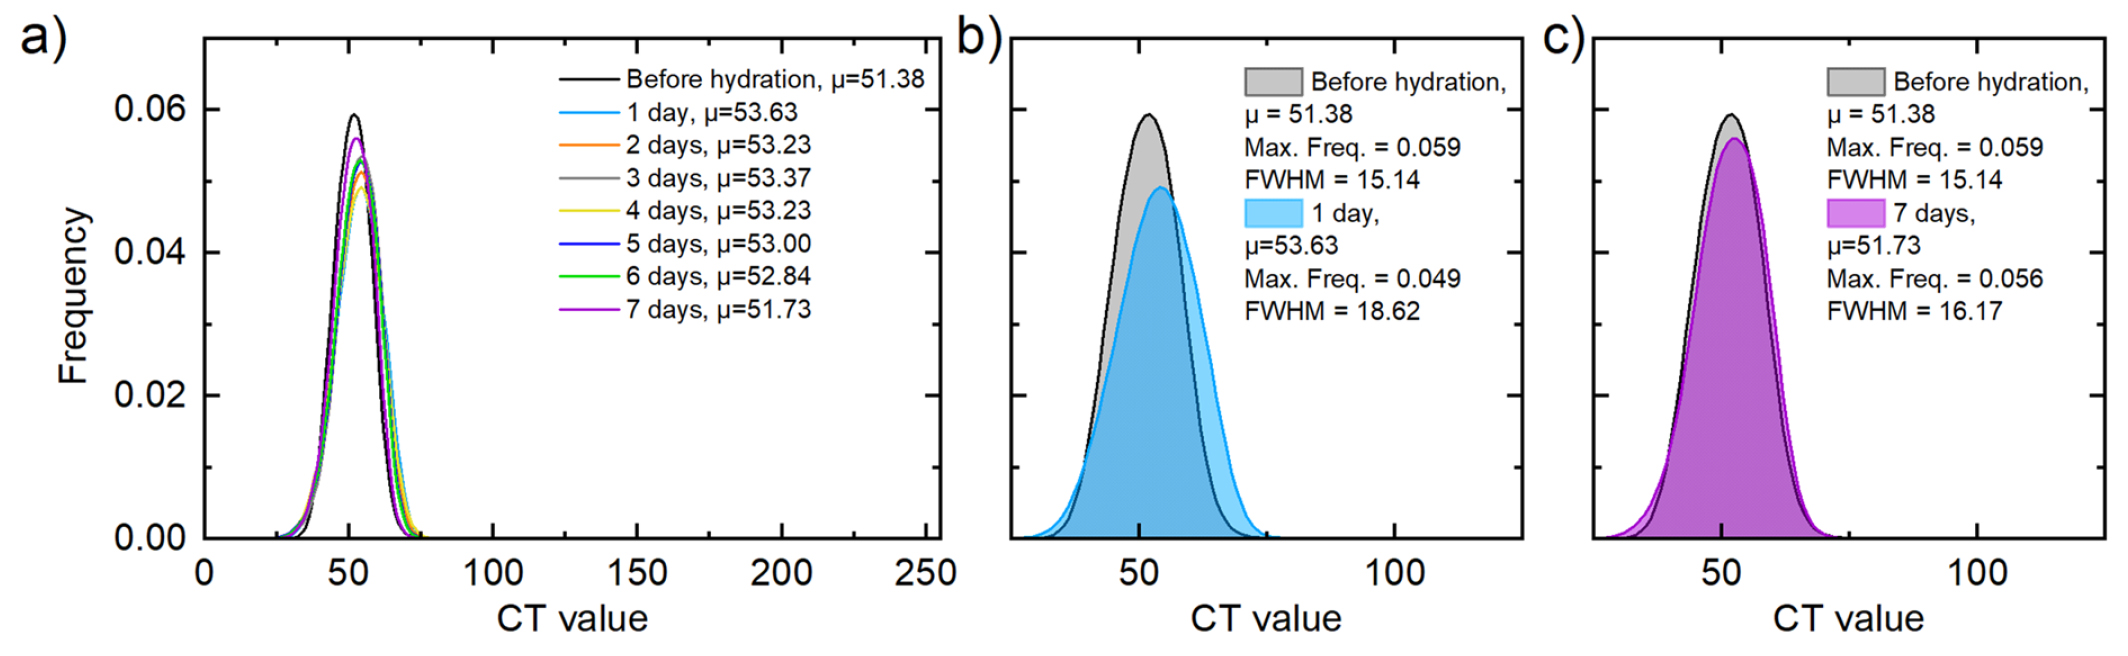
Fig. 3.
a) X-ray CT intensity distribution curves or histograms for bentonite sample before and after hydration at different times. The mean or average CT values (μ) per measure are also indicated. Comparison of histograms before and after one day of hydration (b) as well as after seven days of hydration (c). The maximum frequency and the full width at half maximum (FWHM) are also indicated
To summarize the overall behavior of the bentonite sample under hydration, the mean CT values at different days are shown in Fig. 4. Day zero represents the mean CT value before hydration. The results show how the highest CT value was recorded after 24 hours of hydration, and represents a 4.4% increase from the original state. Afterwards, the sample exhibited a progressive decrease. By the end of testing, the mean CT value was still higher (0.7%), but closer to the original state.
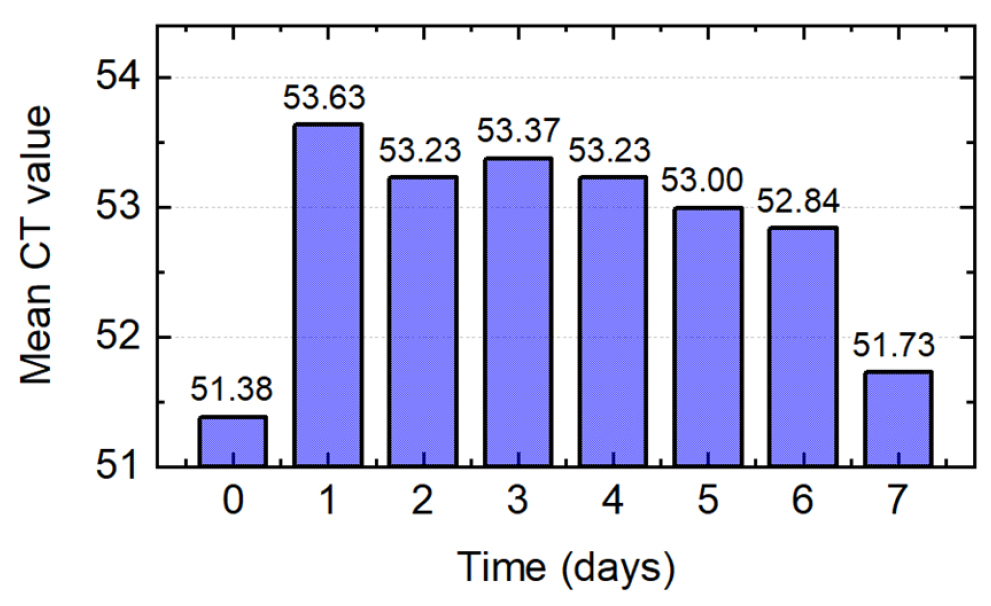
Fig. 4.
Mean CT values measured at different times for bentonite sample subjected to hydration. Time zero represents the state before hydration. The mean values were computed over nearly the entire volume of the sample as indicated in Fig. 2
3.2 X-ray CT results along the sample height
Results of mean CT values, CT standard deviation, and CT gradient per cross section along the sample height are shown in Fig. 5. These values were calculated using the volumes indicated in Fig. 2. There are three observations that can be made from the mean CT values per cross sections along the sample height (Fig. 5(a)). First, the mean values per cross section after hydration decreased near the injection point, but increased for most of the sample. Second, the largest changes occurred after 1 day of hydration, where the middle region reported the highest values, while the bottom and top regions, showed lower values than the condition before hydration. The higher CT values in the middle region correspond to an increase on the dry density due to bentonite swelling. Third, overall the CT profiles exhibit an initial decrease at the lower third of the sample height and an initial increase at the middle and upper thirds. Later, the sample underwent a progressive reduction of these differences, and by the end of testing the CT profile was the closest to the state before hydration, especially at the middle and upper thirds. Bentonite behavior upon hydration has been previously reported. Liu et al. (2022) carried out hydration tests using GMZ bentonite samples made of different mixtures of bentonite pellets and powder. They plotted dry density profiles of a sample measured at different times, and showed how the dry density decreased near the injection point and increased close to the outlet point. Overtime, these differences reduced and the lower dry density near the inlet increased while the higher dry density near the outlet decreased. The final dry density profile after 30 days of hydration was close to the initial state. They reported the same behavior for tests carried out under 20, 40 and 60 °C. Then, the CT profiles presented here resemble the overall behavior of bentonite upon hydration. However, the void regions at the bottom and top induced by the indentations influenced the initial trends.
Moreover, the CT standard deviation values (Fig. 5(b)) measures the amount of variation or dispersion of the CT values per cross section along the sample height. In general, the CT standard deviation underwent a progressive decrease, with the minimum values at the end of testing. However, the maximum values occurred at day 4, and this is thought to represent a stage where particles with high CT values coincided with others of low values, resulting in large CT standard deviations. The reason for particles of higher CT value is due to the hydration process that induced swelling on the bentonite sample, resulting in areas of momentarily higher density. The combination of the mean CT and CT standard deviation results suggests that by the end of testing, the initial increase on the CT values induced by hydration reduced, and the sample became more uniform with a lower variation or standard deviation on the CT values measured at multiple cross sections along the sample height. Finally, the degree on how fast the changes along the sample height occurred can be evaluated with the CT gradient, or in other words, the change in CT values per unit of length (Fig. 5(c)). The larger and faster changes within the sample occurred at the lower third of the sample height, closer to the water injection point. The upper third also experienced some fast changes, but only during the first two days of hydration. Over time, the CT gradient reduced and it exhibited similar values for the middle and upper thirds of the sample. This also shows how the hydration process homogenized the sample because on one hand, the mean CT value progressively decreased and on the other the changes occurred nearly at the same rate along the middle and upper thirds of the sample height.

3.3 Formation and evolution of cracks and voids
The shortcomings during sample preparation and testing had important effects on the behavior of the bentonite sample. As explained above, previous studies have shown how after the onset of hydration, the minimum and maximum dry densities were recorded near the inlet and outlet points, respectively. However, the mean CT profiles in the previous section reported lower values near the outlet point after 1 and 2 days of hydration. This is most likely a result of the swelling of that section that filled out the indentation of the top cap. At the same time, it is possible that the lower values recorded near the inlet were also influenced by the swelling of the lower section that also filled out the indentation at the bottom as shown in Fig. 2. In addition, the CT vertical section after one day of hydration revealed the occurrence of cracks at the bottom of the sample. In order to quantify the formation and evolution of cracks and voids, we plotted the CT values (more specifically, the voxels) equal or less than 20 in Fig. 6. This range from 0 to 20 was defined after inspecting the lower region of the CT images captured at one day of hydration. Cuboid regions of different sizes were extracted to characterize the voids before and after hydration. A cuboid of 19 × 19 × 23 mm was used before hydration due to the detachment of fragments at the top of the sample that was shown in Fig. 2. For the crack characterization after hydration the cuboid region was larger, with 20 × 20 × 33 mm. Nearly no voids were observed before hydration. In contrast, after 1 day of hydration multiple cracks can been seen at the bottom of the sample. At the second day of hydration, the number of cracks reduced and smaller disperse voids also formed. Subsequently, the cracks disappeared and only very small voids are observed, especially near the inlet point.
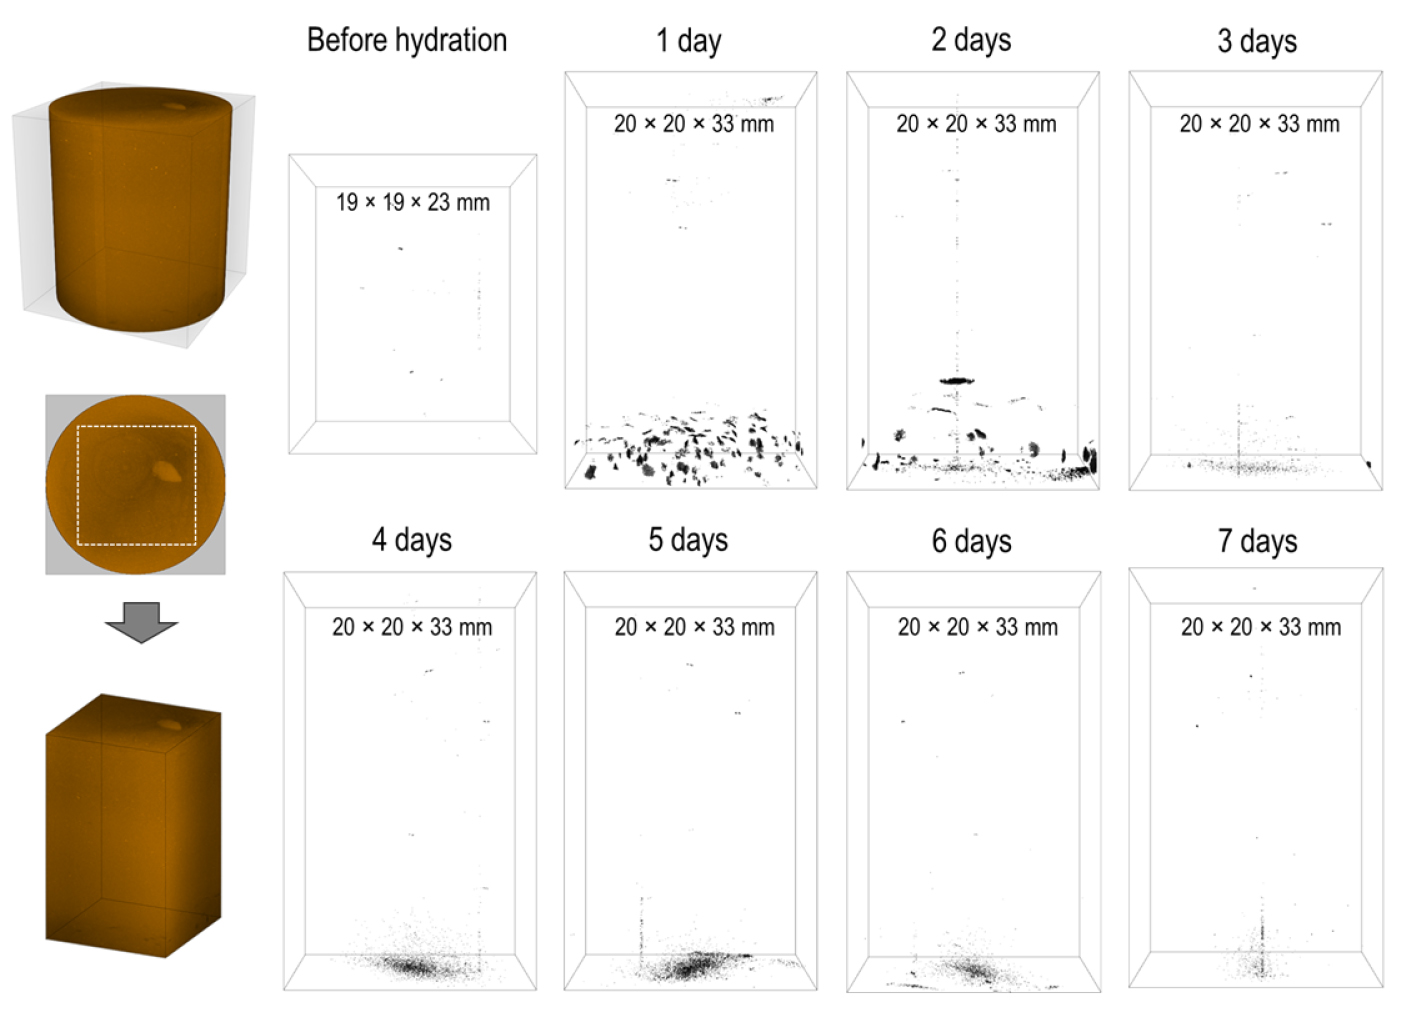
Fig. 6.
Sequence of cuboid regions used to display and measure the formation and reduction of cracks and voids. The analyzed volume before hydration was smaller due to the detachment of fragments at the top of the sample. However, after hydration, the analyzed volume was the same. The cracks were extracted using a range of 0 to 20 CT units defined based on CT observations.
Since voxels represent a unit of volume, their values can be used to compute the percentage of the volume of voids of the selected region of analysis. The results of the volume of voids expressed as percentage for different times are shown in Fig. 7. Time zero represents the state before hydration, where the volume of voids was nearly zero with an actual value of 0.0004%. However, the volume of voids increased during the first two days of hydration, with a maximum at the second day. From the third day, the volume of voids reduced and by the end of testing, the value was close to that of the initial state.

The preliminary hydration test presented here was meant to evaluate the feasibility of applying X-ray CT technology to characterize the changes in bentonite upon hydration inside a recently developed in-house hydration cell. Despite the drawbacks during and after test assemble, the effect of the indentations at the bottom and top cap, and the limitations on the recorded parameters during testing, the CT monitoring have shown to be a useful tool to characterize the test with great detail. First, the scanning before hydration allowed to detect the condition of the sample after assemble. As it was discussed before, the detachment of fragments at the top of the sample had a clear effect on the behavior. At the same time, the observations during the first day of hydration showed how the unrestricted condition of the sample allowed swelling to mobilize material and fill out the indentations at the bottom and top. Also, the CT scans showed the development of cracks during the first days of hydration. Second, the CT histograms provided mean CT values of the sample at different times, and gave insights of the overall behavior of the samples upon hydration. Third, the CT profiles of different parameters measured along the sample height provided a better understanding on how the hydration process induced changes in the sample. For example, it was possible to observe the decrease on density not only at the bottom near the injection point, but also at the top during the first days of hydration. Last, CT technology allowed to identify and characterize the evolution of cracks and voids. Future works will consider the careful sample and test preparation, measurement of other parameters such as the swelling pressure, and the correlation of CT values with dry densities, making it possible to associate CT with dry density values.
4. CONCLUSIONS
An assessment on the feasibility of applying X-ray CT technology on the characterization of bentonite upon hydration inside a recently developed testing cell has been presented. The hydration cylindrical cell was made of plastic, with a removable top section to allow the placement of the sample. Water is injected at the bottom and collected at the top of the cell. The cell sits inside an aluminum frame that allows displacement or swelling pressure recordings. The preliminary hydration test was carried out using a cylindrical sample made of Gyeongju bentonite, with a dry density of 1.4 g/cm3, and a water content of 20%. The sample had a diameter of 27.5 mm and a height of 34 mm. During the test, water was injected at a constant pressure of 0.207 MPa, and lasted for 7 days. The main conclusions are listed below.
X-ray CT technology has shown to be a useful tool on the characterization of the samples before and after hydration. CT inspection before hydration inside the new cell allowed to detect the detachment of small fragments at the top of the sample after assemble. After one day of hydration, CT inspection indicated the mobilization of bentonite to the bottom ant top caps resulting from the testing setup, and indicated the formation of small cracks at the bottom of the sample. CT histograms computed from nearly the entire volume of the sample showed how the hydration process induced an initial increase and later progressive decrease on the density of the sample. Moreover, detailed profiles of mean CT values, CT standard deviation, and CT gradient gave more insights on the changes along the sample height over time. The bottom and top of the sample, near the injection and outlet regions, showed a decrease on the CT values or bentonite density during the first two days of hydration, while the middle region exhibit an increase on the CT values. Afterwards, the differences reduced and by the end of testing the CT values were similar to those in the initial state, especially at the middle and upper regions. Also, CT scanning aided to identify and characterize the formation and later reduction of cracks and voids. Finally, these results indicate that it was possible to characterize the bentonite sample under hydration using the newly developed cell, which represents an advantage as the inspection can be carried out without disturbing the test.
