

1. INTRODUCTION
2. CFD ANALYSIS OF THE PRESSURIZATION VENTILATION TECHNIQUES
2.1 CFD analysis method
2.2 Scenario 1: pressurization ventilation technique by a single unducted fan
2.3 Scenario 2: pressurization ventilation technique by a single bulkhead equipped with a fan
2.4 Scenario 3: pressurization ventilation technique by double bulkheads equipped with a fan
3. APPLICABILITY OF THE PRESSURIZATION TECHNIQUES AT A LARGE-OPENING LIMESTONE MINE
3.1 Study method
3.2 Efficiency of the pressurization technique
4. CONCLUSIONS
1. INTRODUCTION
Backfilling of voids generated by mining is a fundamental component of most underground stopping operations. Without backfill, these operations would be unsafe, less productive and shorter in life. It is expected that large quantities of free gas types of NH3 and CO2 gas will leak into the atmosphere as well as the working space in the mining area, which is backfilled with the complex carbonate of the power plant. Therefore, it is necessary to control the thermal environment such as temperature and humidity, air quality as dust and gas inside the workspace due to backfill, and also to minimize the leakage of harmful substances during and even after the curing period of backfilling. In the underground limestone mines in Korea, the conventional ventilation system by large-capacity axial-flow fans along with long tubings may be impractical to control the toxic gas during the backfill curing period since those mines are developed by multi-levels and the intake and return airways are not clearly maintained. Thus, the ventilation system targeted is to supply sufficient pressure on the working face and consequently to minimize the discharge of harmful gases after backfilling in long term. The purpose of this study is to investigate low-cost ventilation technology that can control gas leakage and dispersion from the backfilled area during and after the curing period by pressurization techniques.
The successful operation of pressurization system remains a standard feature of high rise building codes in USA, UK, Australia, China, India, the UAE and many others locations. A pressurization system applied in buildings is designed to prevent smoke leaking passed closed doors into stairs by injecting clean air into the stair enclosure such that the pressure in the stair is greater than the adjacent fire compartment (Lay, 2014). The studies on the pressurization system by Tamura (1989, 1992), Budnick (1987), Wang et al. (2004), Jo et al. (2007) and Li et al. (2018) are the backgrounds for the development of ventilation schemes for gas leakage and dispersion controlling at the backfilled underground mine sites. According to the British standards BS EN 12101-6 “Specification for Pressure Differential Systems” (BS, 2005) and BS 5588-4 “Code of practice for smoke control using pressure differentials” (BS, 2016), there are two requirements to maintain within a pressurization system. Firstly, based on BS EN 12101-6 and BS 558-4, the minimum pressure differential between inside and outside of the pressurized zone is 50 Pa. Secondly, maintaining a velocity for an open door condition. the airflow discharged from the pressurized zone through the doorway should be not less than 2.0 m/s. In this study, based on two requirements of pressurization system principles, a series of CFD scenarios were developed for evaluating the ventilation efficiency by varying fan capacity and design of the bulkhead to adapt the minimum differential pressure of 50 Pa and the doorway velocity condition. In addition, a pressurization technique with two auxiliary fans is also developed. Its application is tested by the mine site experiment and also CFD analysis. This study aims at providing fundamental information to design the pressurization ventilation system to control the toxic gas leakage from the backfilled area and dispersal of the contaminants within the working space.
2. CFD ANALYSIS OF THE PRESSURIZATION VENTILATION TECHNIQUES
2.1 CFD analysis method
Application of the CFD technique in mine ventilation can help mining engineers to analysis complex air flow fields and contaminant transport in order to design more economical and safer ventilation system (Ali Haghighat, 2014). In this study, CFD analysis was carried out using ANSYS FLUENT which has commonly been used by many researchers to study various fluid-flow and heat transfer problems in the underground mine environment (ANSYS, Inc., 2018). To develop the pressurization techniques for the gas leakage and dispersion control in the underground limestone mines backfilled area, three CFD scenarios were tested for the evaluation the ventilation efficiency by varying fan capacity and bulkhead installation. The CFD scenarios are described in Table 1. A CO source with the strength of 0.2 kg/s was assumed to be located at the face to simulate the gas leakage.
The fan characteristics used in the CFD analysis are shown in Table 2 and Table 3 summarizes the initial conditions for the analysis. The turbulence model was employed in this CFD study.
Table 1. CFD scenarios description

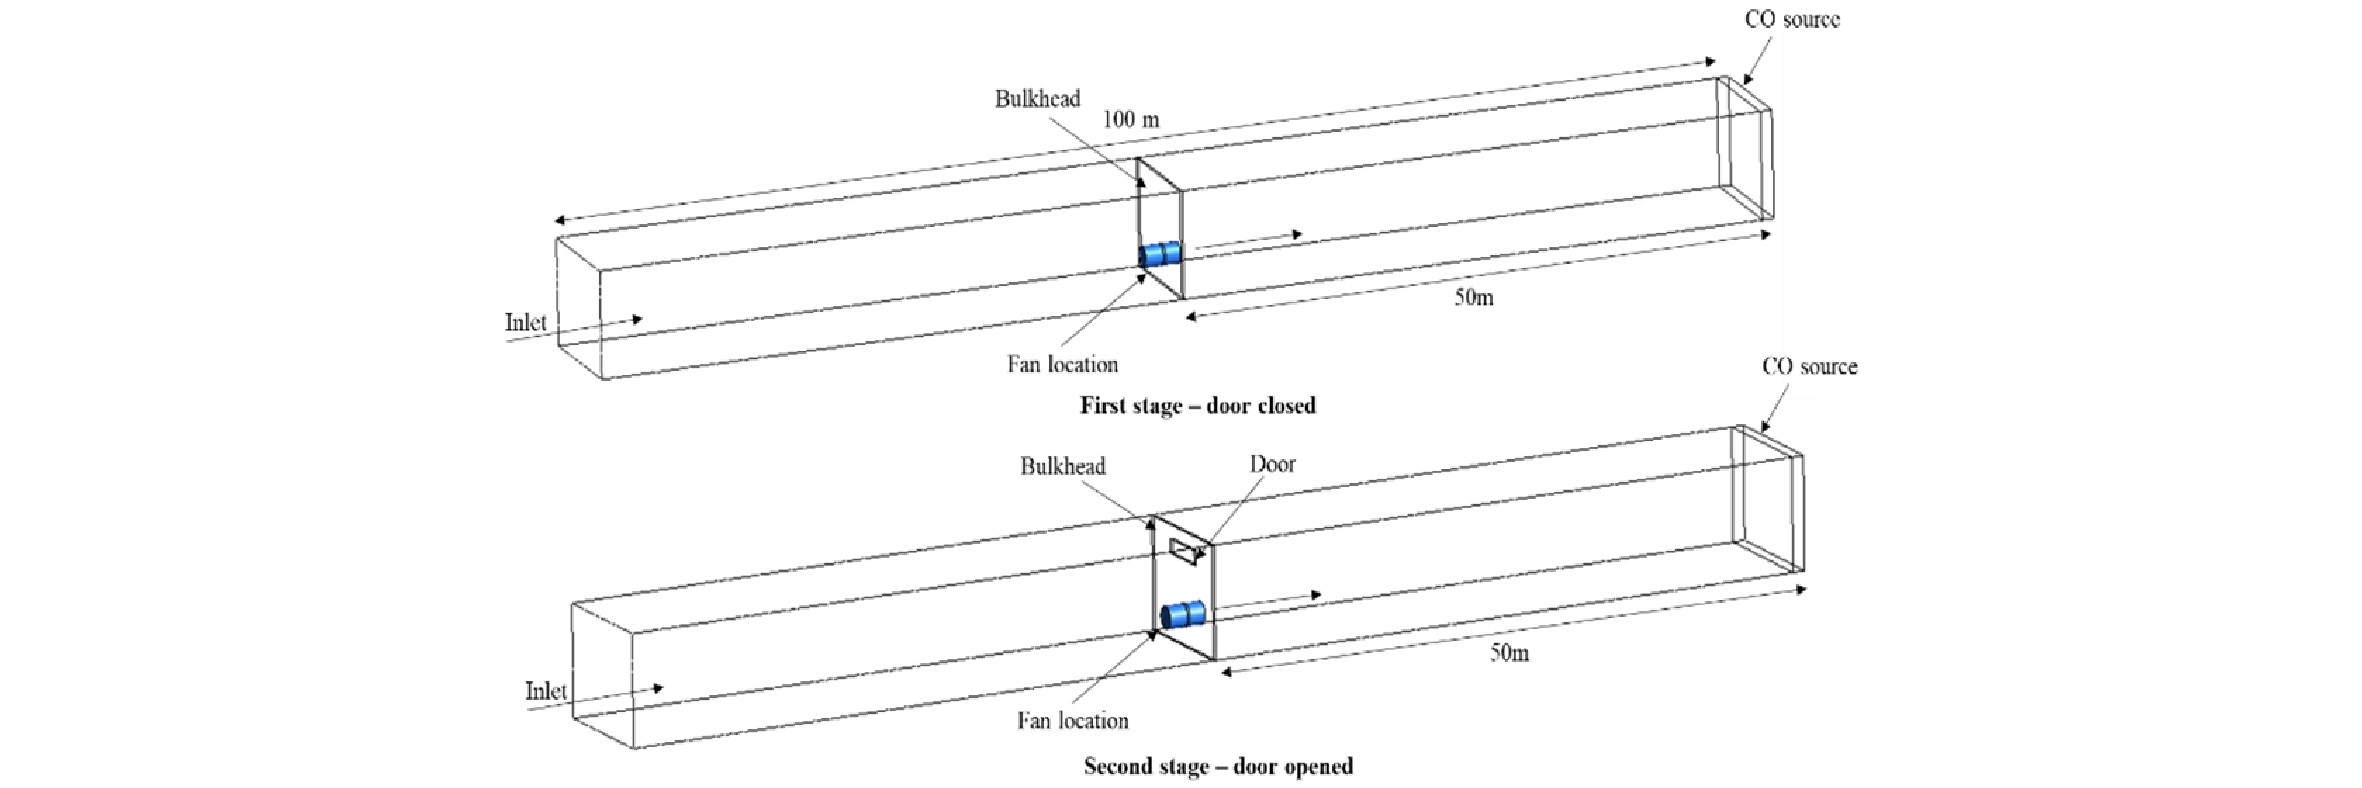
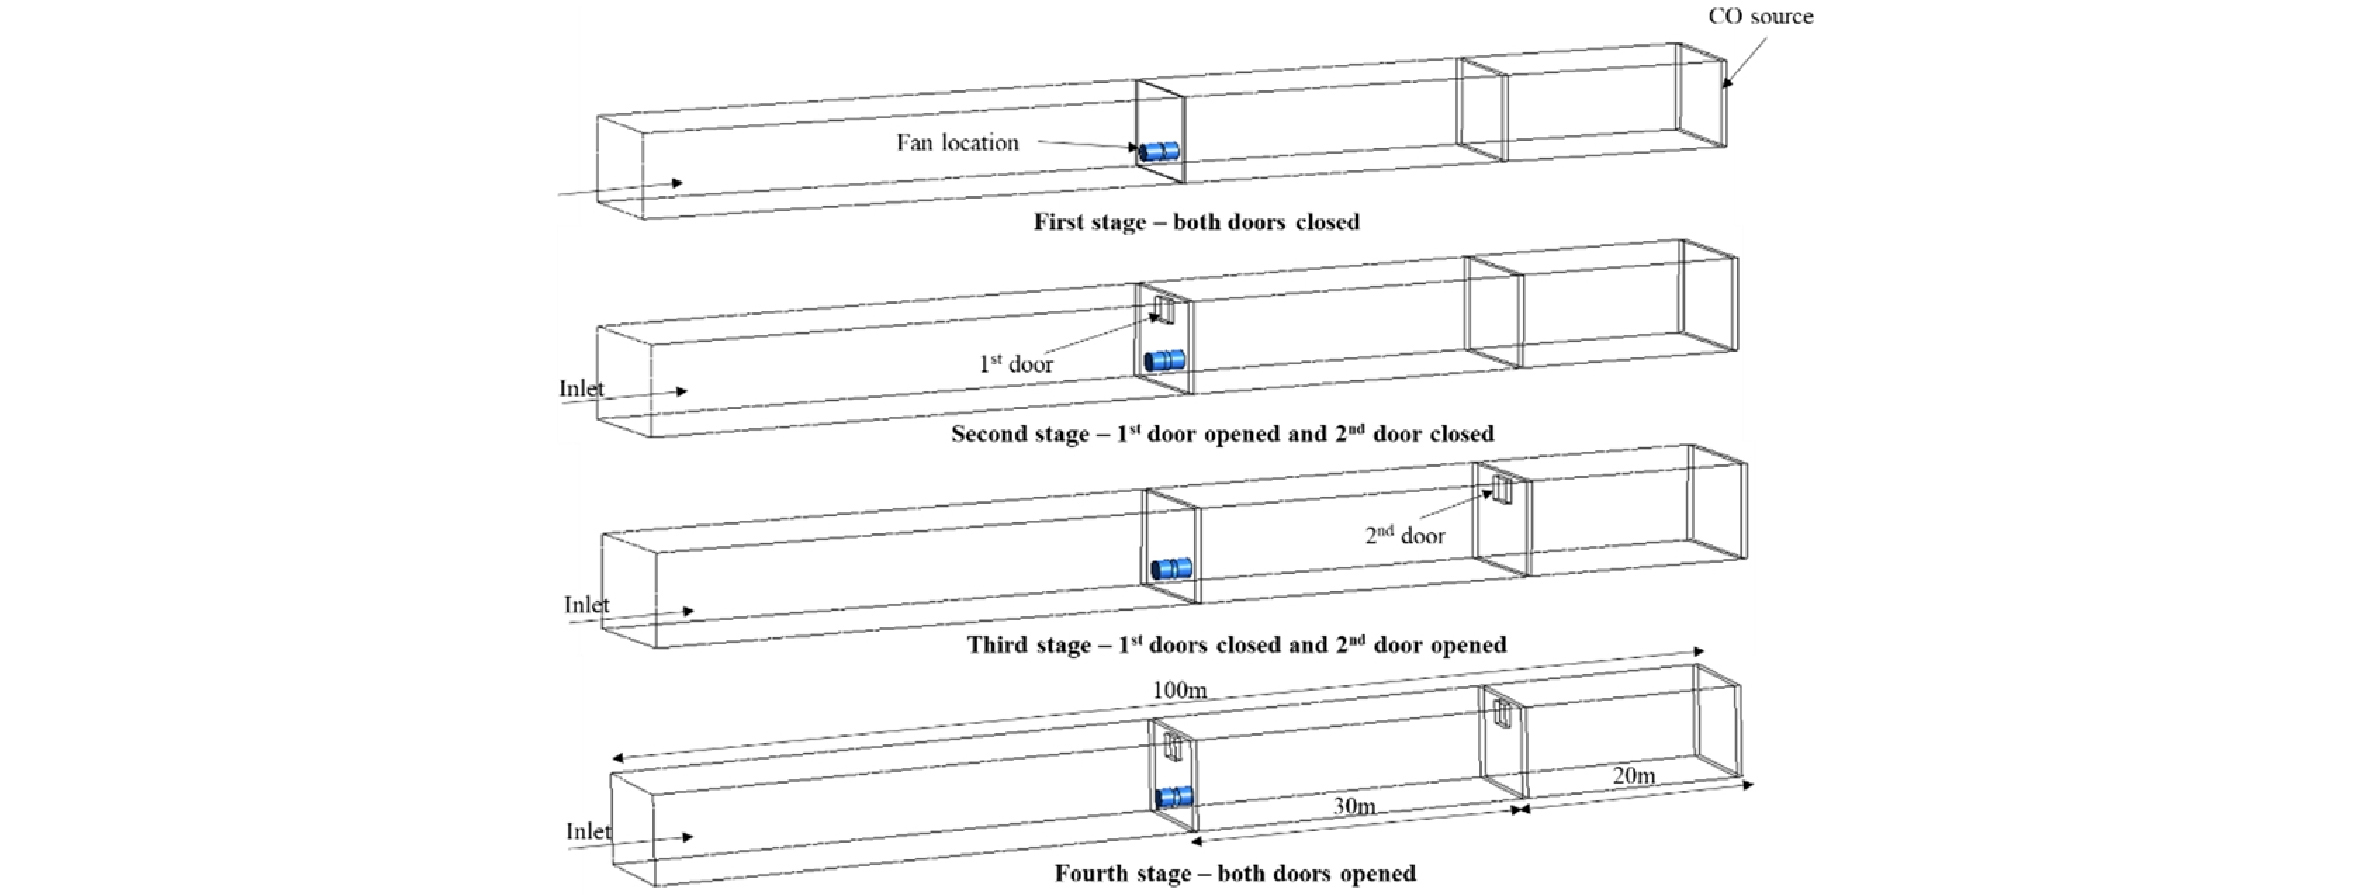
Table 2. Fan characteristics
| Category | Characteristics |
| Fan type | Axial-flow fan |
| Fan dimension | L:3 m Ф:1.6 m |
| Fan operation | Blowing and exhaust modes |
| Fan installation height | 1.5m (fan center point location) |
Table 3. Initial conditions of CFD analysis
2.2 Scenario 1: pressurization ventilation technique by a single unducted fan
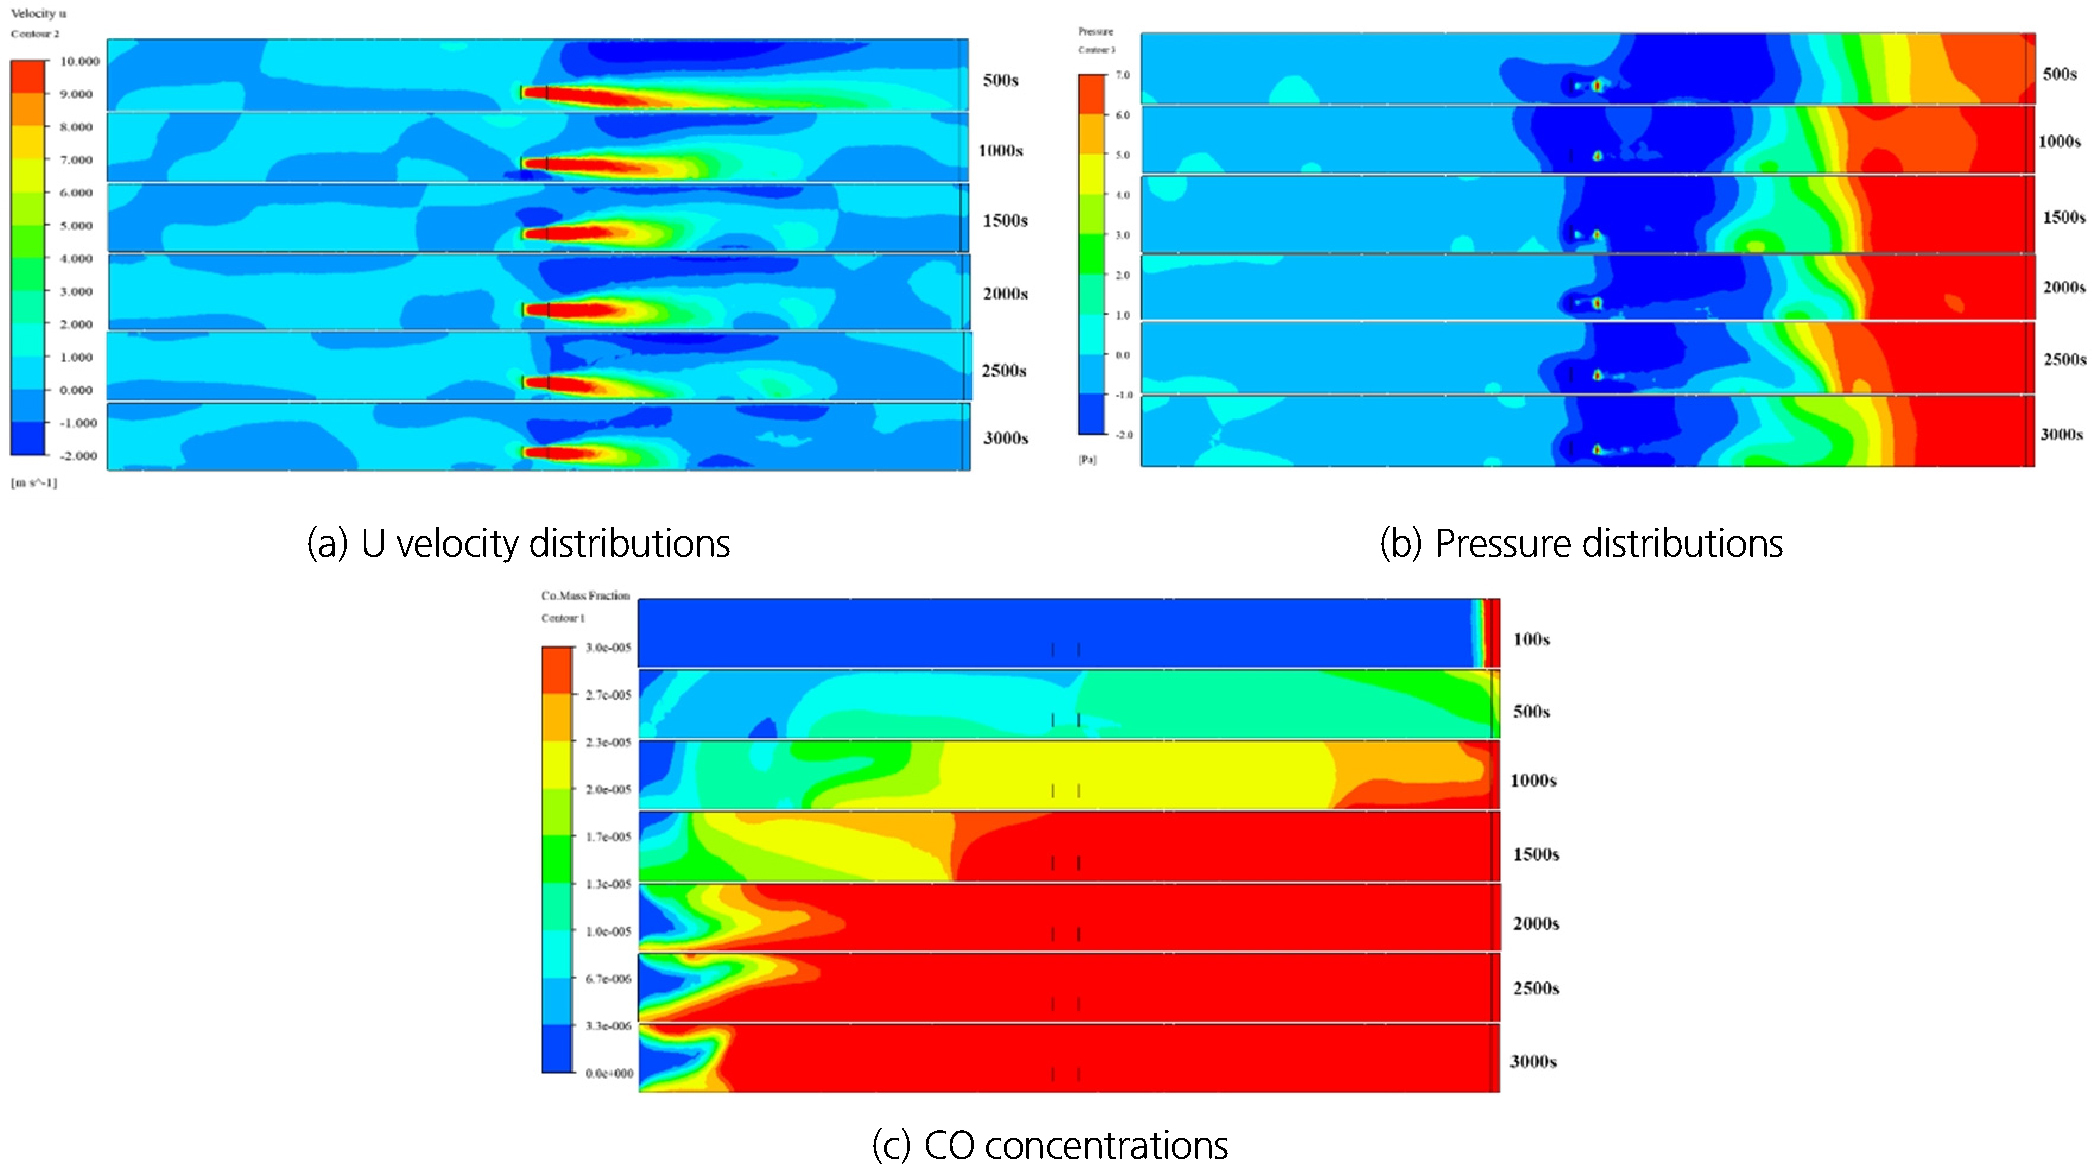
Fig. 1 shows the CFD results with the unducted 100N fan for the simulation time of 3000 seconds. It shows the effectiveness of the pressurization technique using a unducted fan in single-blind airway. Fig. 1 (a) illustrates the U velocity contour distribution. It can be seen that the air was recirculated between the fan location and the working face, while in Fig. 1 (b) the pressurization was observed near the working site and the differential pressure between the high and low pressure zones was 7-8 Pa. Fig. 1 (c) shows the CO concentration profiles during 50 minutes of fan operation and the high CO concentration area above 30 ppm was expanded over the entire 100m-long airway.
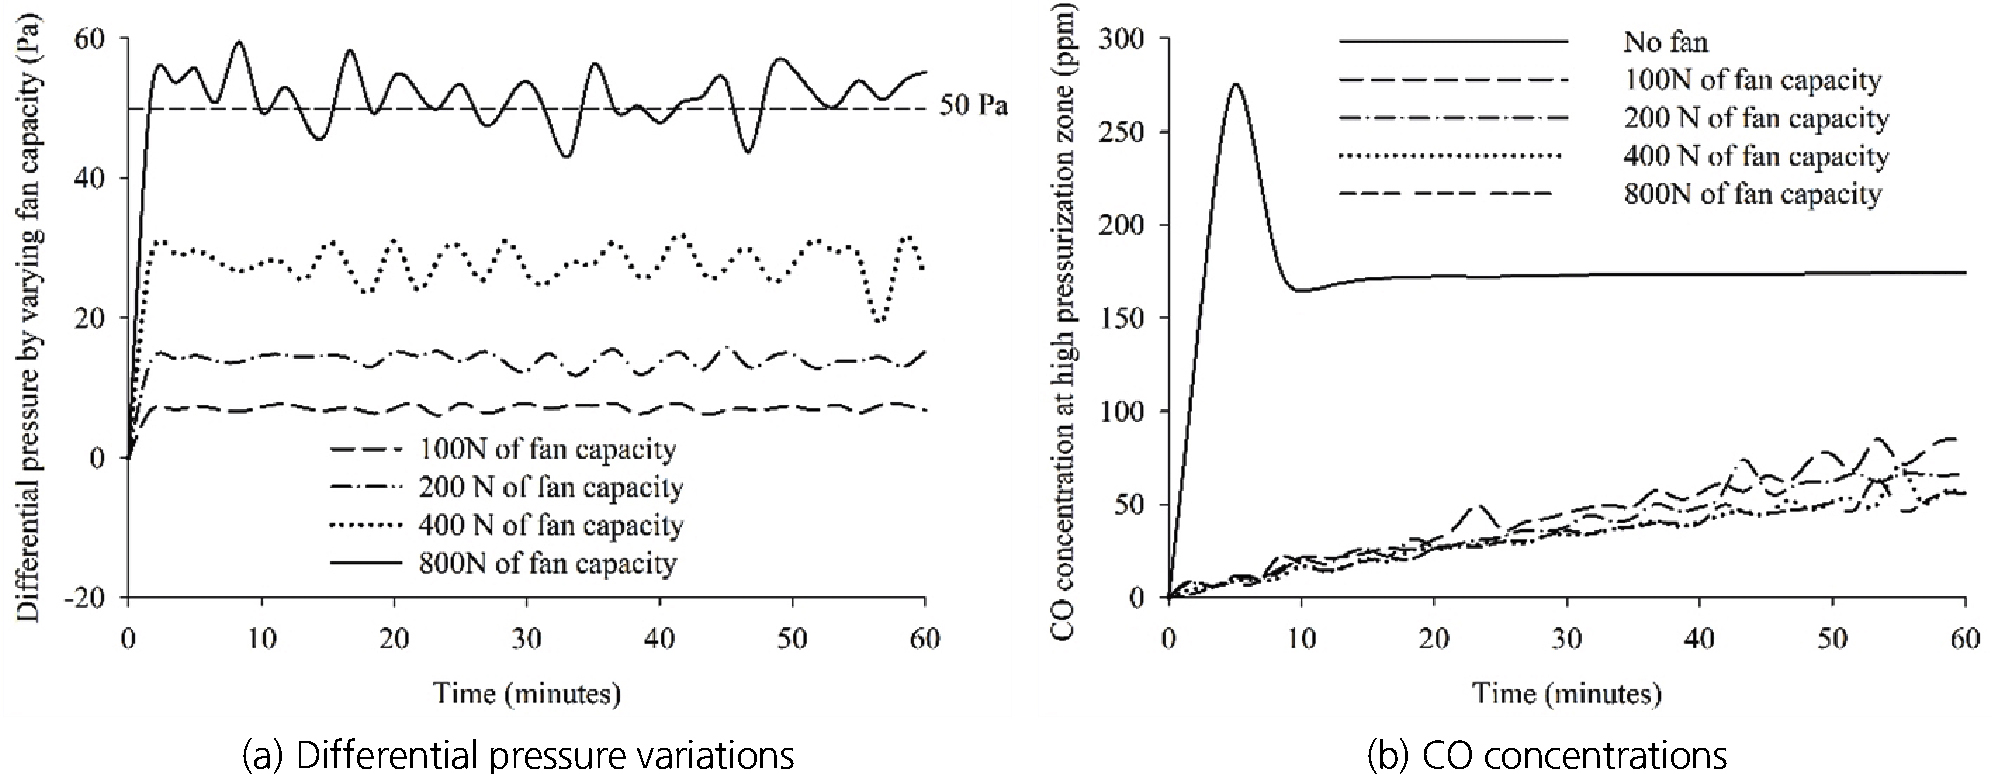
Based on the recommendations of BS EN 12101-6 and BS 5588-4, it is critical to create the minimum differential pressure of 50 Pa for the pressurization technique. Fig. 2(a) shows the differential pressures between the high and low pressure zones by varying the fan capacity. Among the fan capacity of 100 N, 200 N, 400 N and 800 N, the minimum differential pressure of 50 Pa can be created only by the fan capacity of 800N. Thus, in Scenario 1 with a single unducted fan where bulkhead was not constructed, it requires the huge fan capacity to create the differential pressure of 50 Pa. The effects of fan operation on the CO concentration at the working face are plotted in Fig. 2(b). After the fan operation for one hour, CO concentration of 160 ppm could be maintained without a fan, while its concentration was reduced to 83 ppm in case of 100N fan. The CO concentrations were 55-66 ppm with the fan capacities of 200N, 400N and 800N; larger fan further reduced the concentration near the face. Hence, in case of the single unducted fan, a huge fan capacity is necessary to generate the differential pressure of 50 Pa, but CO concentration was relatively high even with higher fan capacity.
2.3 Scenario 2: pressurization ventilation technique by a single bulkhead equipped with a fan
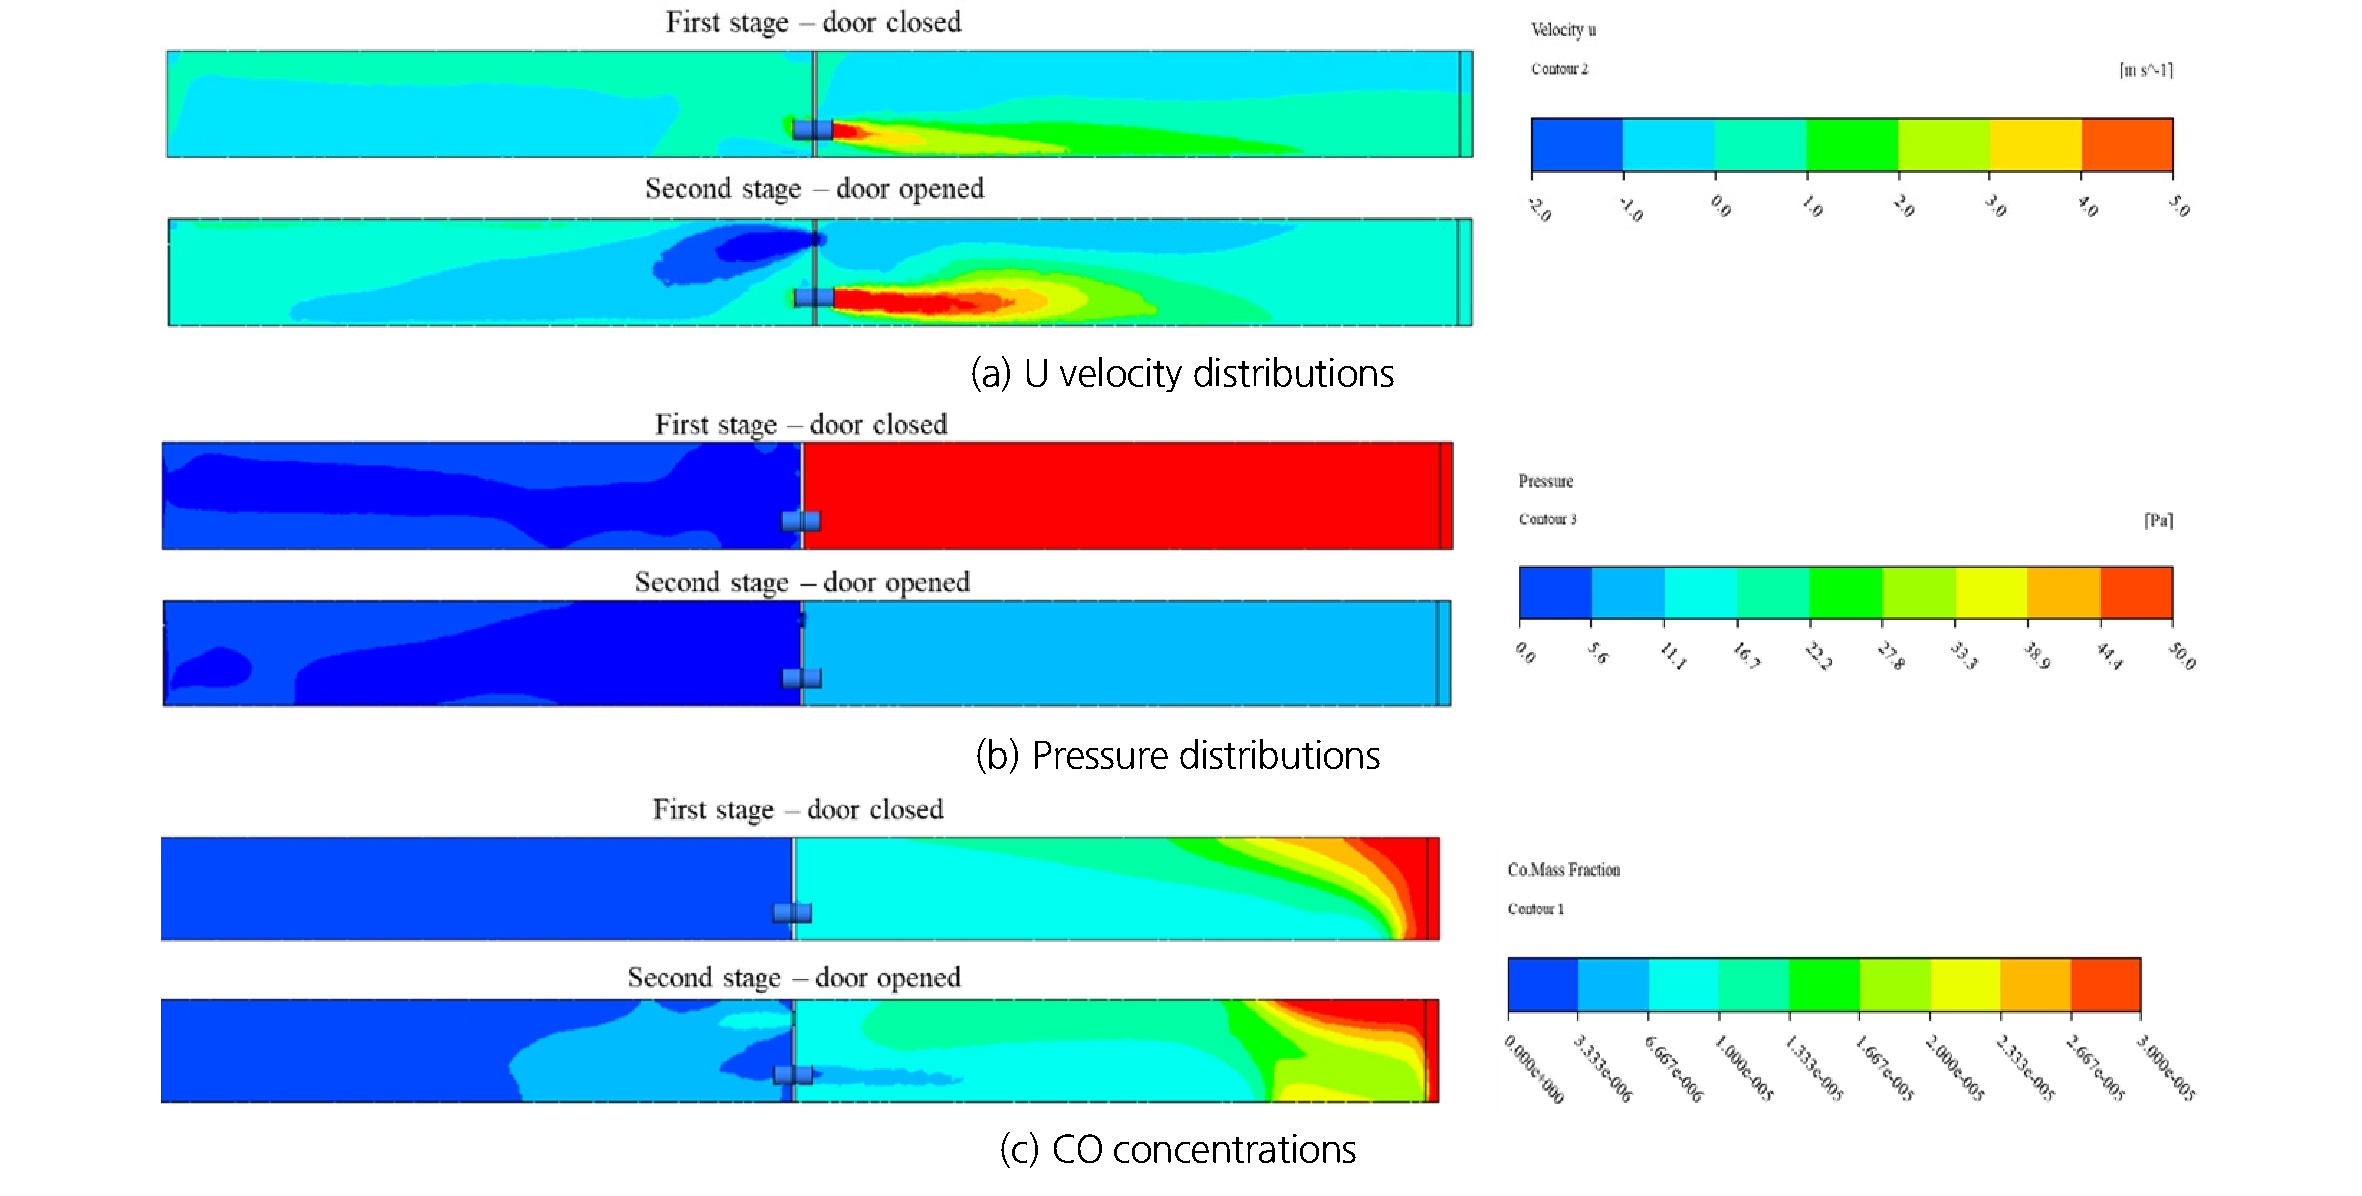
Since huge fan capacity is required to satisfy the standard of differential pressure in Scenario 1, it is impractical to apply a single unducted fan for pressurization due to large capital and operating costs. In Scenario 2, a bulkhead equipped with a fan was taken into consideration for pressurization. A single bulkhead with a door was installed at 50 m from the face. The pressure profiles and the airflow behavior in the pressurization zone were observed for the cases of closed and opened door. Fig. 3 shows the CFD results with a single bulkhead and a 30N fan. Fig. 3(a) shows the U velocity contour distributions in the two cases: the door closed and door opened. It can be seen that there is no significant difference in velocity inside the bulkhead zone between two cases. However, the completely different pressure distributions are shown in Fig. 3(b). The differential pressure of 50 Pa could be observed when the door was closed, while the differential pressure was reduced rapidly from 50 Pa to 8 Pa when the door was opened after pressurization. Fig. 3(c) illustrates the CO concentrations for the two cases. When the door was closed, CO did not leak through the impermeable bulkhead. However, if the door was opened, CO was dispersed quickly through the door. Thus, to prevent leakage, the door should be kept closed most of the time.
The effect of the door opening is described in Fig. 4. The pressure inside the pressurized zone after opening the door and airflow at the doorway can be seen in Fig. 4. As shown in Fig. 4, the differential pressure dropped steeply from 74 Pa and 52 Pa to 13 Pa and 8 Pa for the cases of 40N and 30N fan within 60 seconds, respectively. The reduced level of differential pressure remained steady at these values. Thus, installation of a single bulkhead equipped with a 30N fan seems to be sufficient to create the differential pressure of 50 Pa between the inside and outside the pressurized zone.
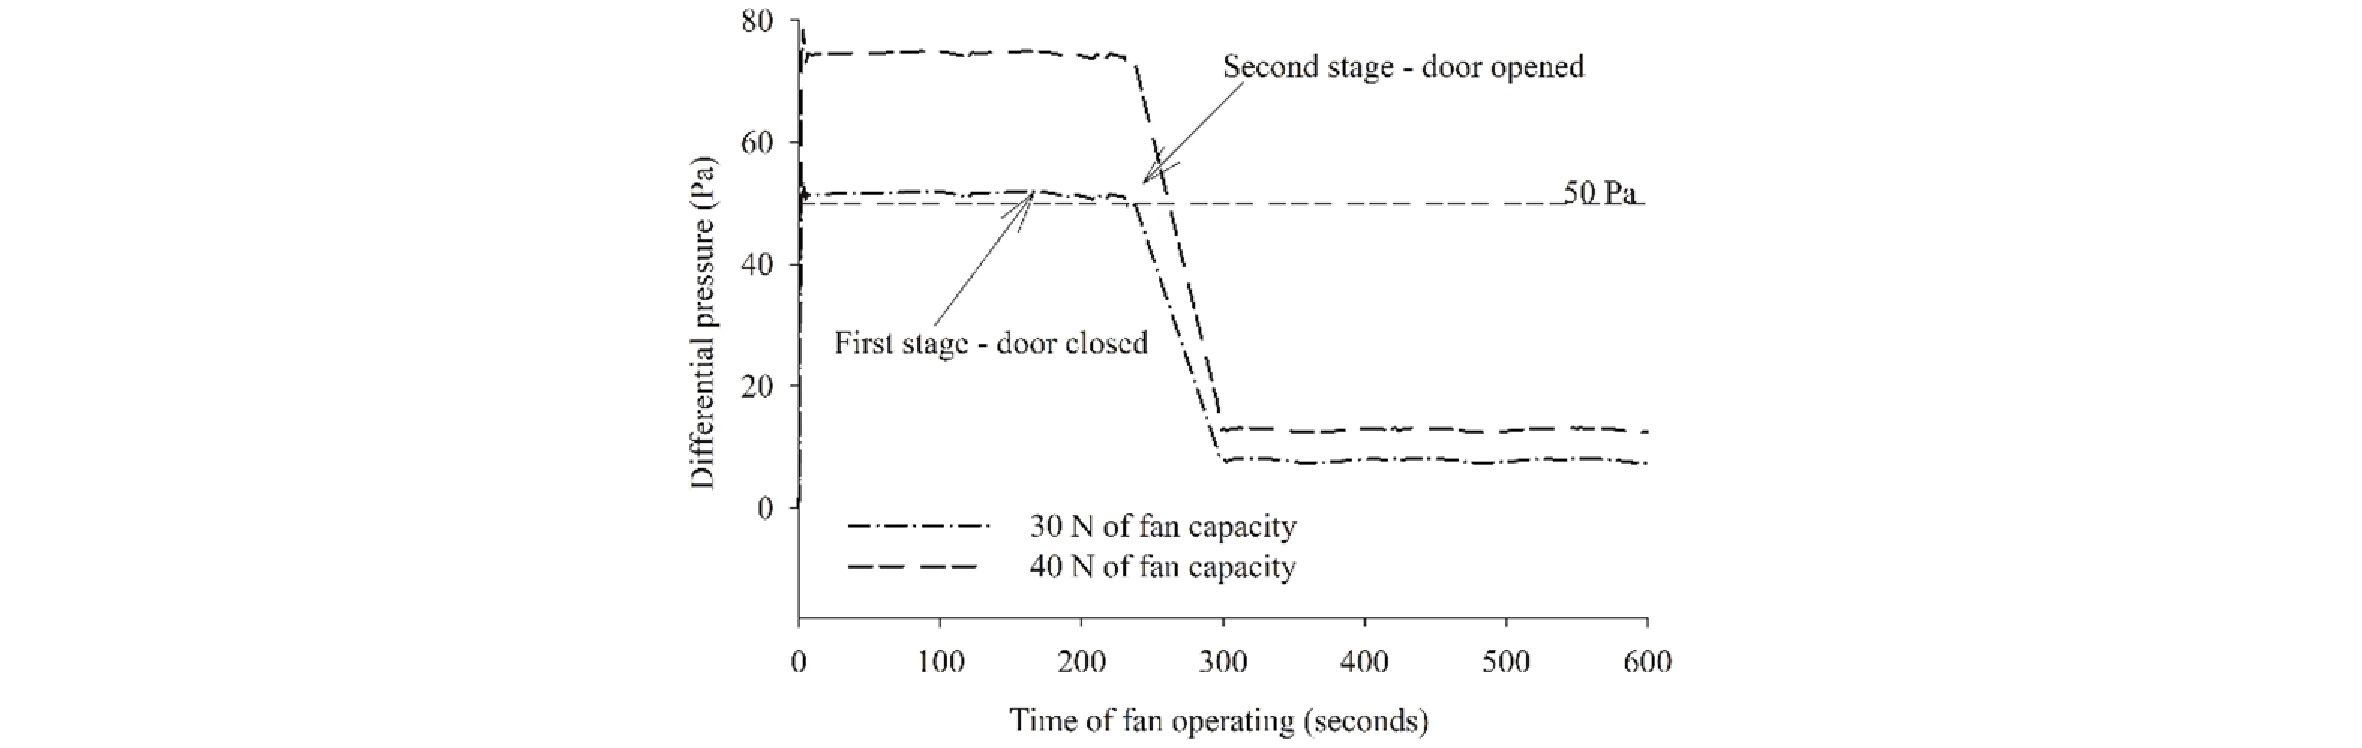
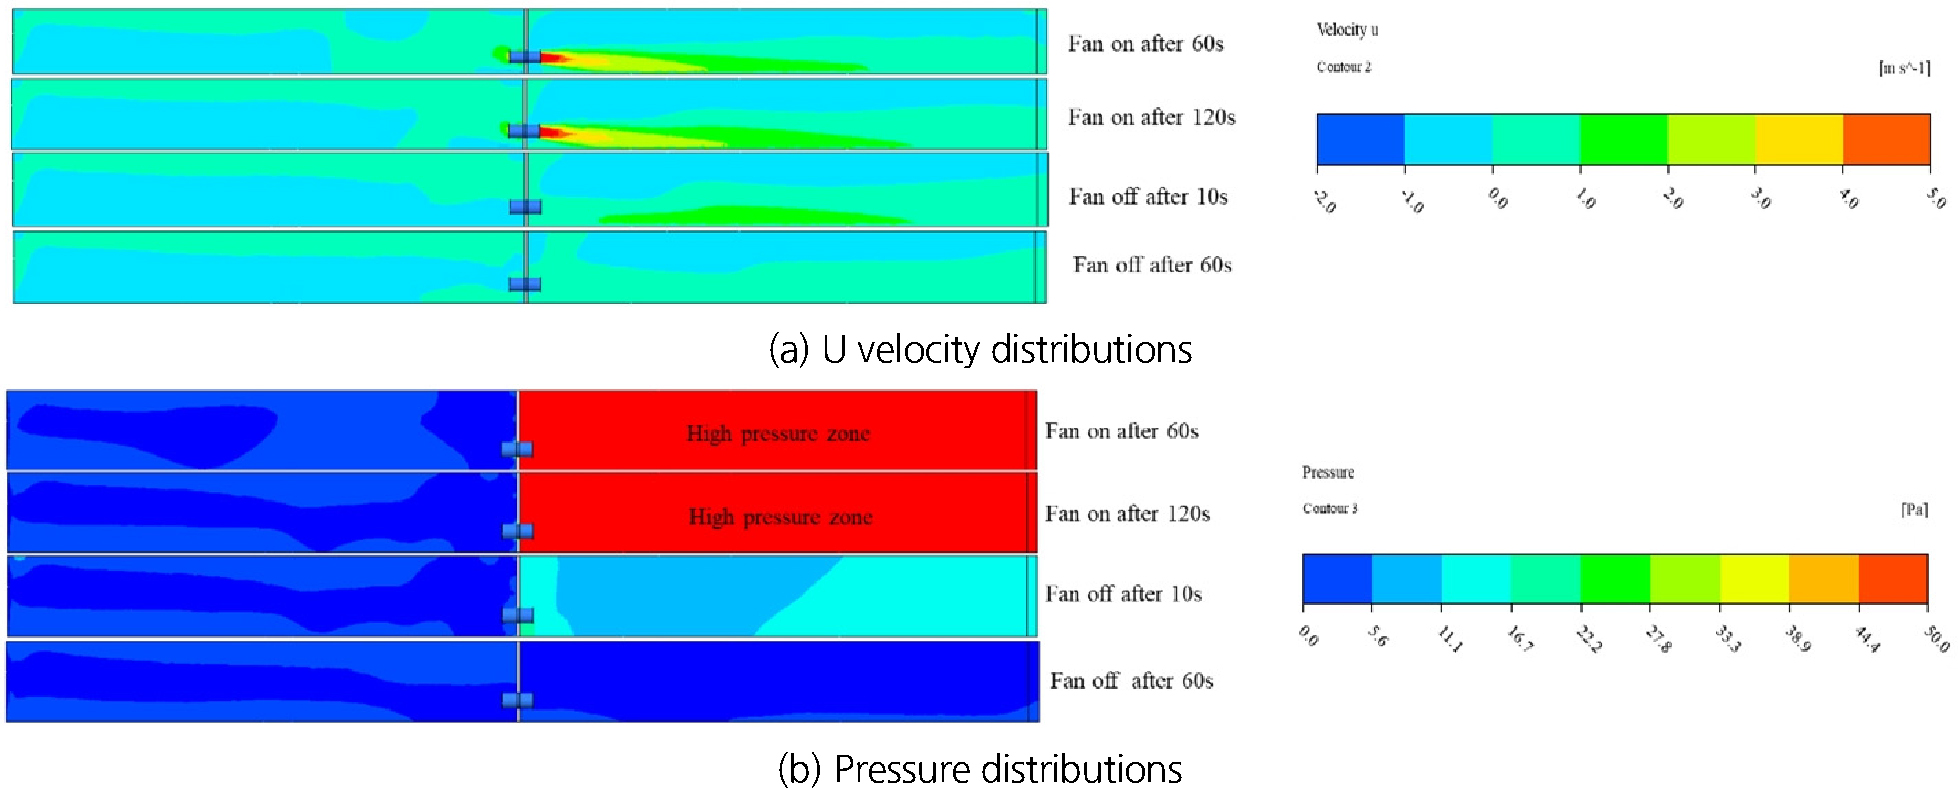
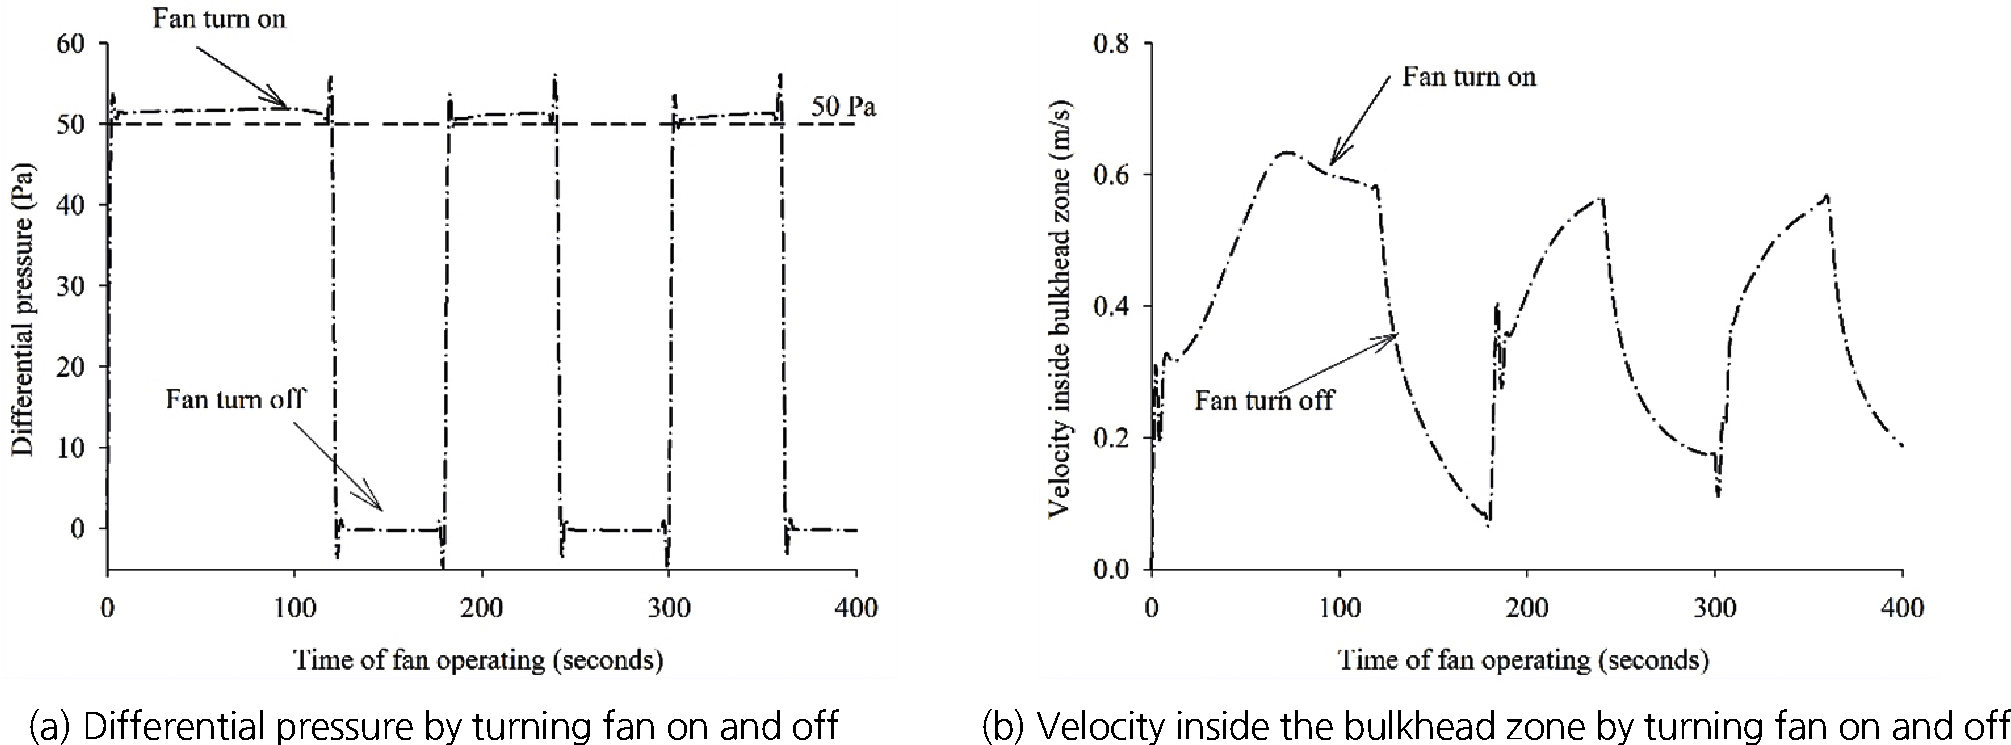
Fig. 5 and Fig. 6 show the temporal changes of the airflow velocity and pressure before and after turning the fan off. After 60 seconds of fan operation, the velocity observed near the face was 0.6m/s near the face as shown in Fig. 6(b), and then, the velocity was dropped to 0.1 m/s after turning the fan off. Pressurization zone showing the differential pressure higher than 50 Pa can be detected when the fan was turned on in Fig. 5(a) and Fig. 6(a). However, at 10 seconds after shutting off the fan, the differential pressure was 10 Pa, and this pressure was reduced rapidly to 0 Pa after 60 seconds. Its fluctuation can be clearly seen in Fig. 6(a). This indicates that the fan should be operated constantly to maintain the differential pressure above 50 Pa.
2.4 Scenario 3: pressurization ventilation technique by double bulkheads equipped with a fan
It was observed that the required level of differential pressure couldn’t be maintained with a single bulkhead when the door was opened. CO contained in the pressurized zone was leaked out rapidly through the door and consequently, the inside pressure was reduced instantaneously. In Scenario 3, one more bulkhead was installed to establish a pressured zone between the working face area and the airway space. Four different cases shown in Table 1 were tested. Fig. 7 illustrates the CFD results of two bulkheads equipped with a 30N fan. The velocity, pressure and CO concentration distributions during four stages are illustrated; in the first stage, both doors were closed, one of the doors was opened in the second and third stage and both doors were opened in the fourth stage. The airflow velocity higher than 2.0 m/s can be observed through the opened door in the second stage as shown in Fig. 7(a). In the first stage with both doors closed, the differential pressure between two bulkheads immediately rose to 50 Pa, and it dropped to 8 Pa in the second stage with the first door opened. In the third stage, the second door was opened while the first door was kept closed. The whole space including the working face was shown to be pressurized well above 50Pa as in Fig. 7(b). When both doors were opened in the final stage, the pressure dropped rapidly to 8 Pa after 60 seconds as in Fig.7 (b) and Fig. 8(a). These results show that when the first door equipped with a pressurizing fan is closed, bulkhead zone and the working space can be pressurized above 50Pa regardless of the status of the second door.
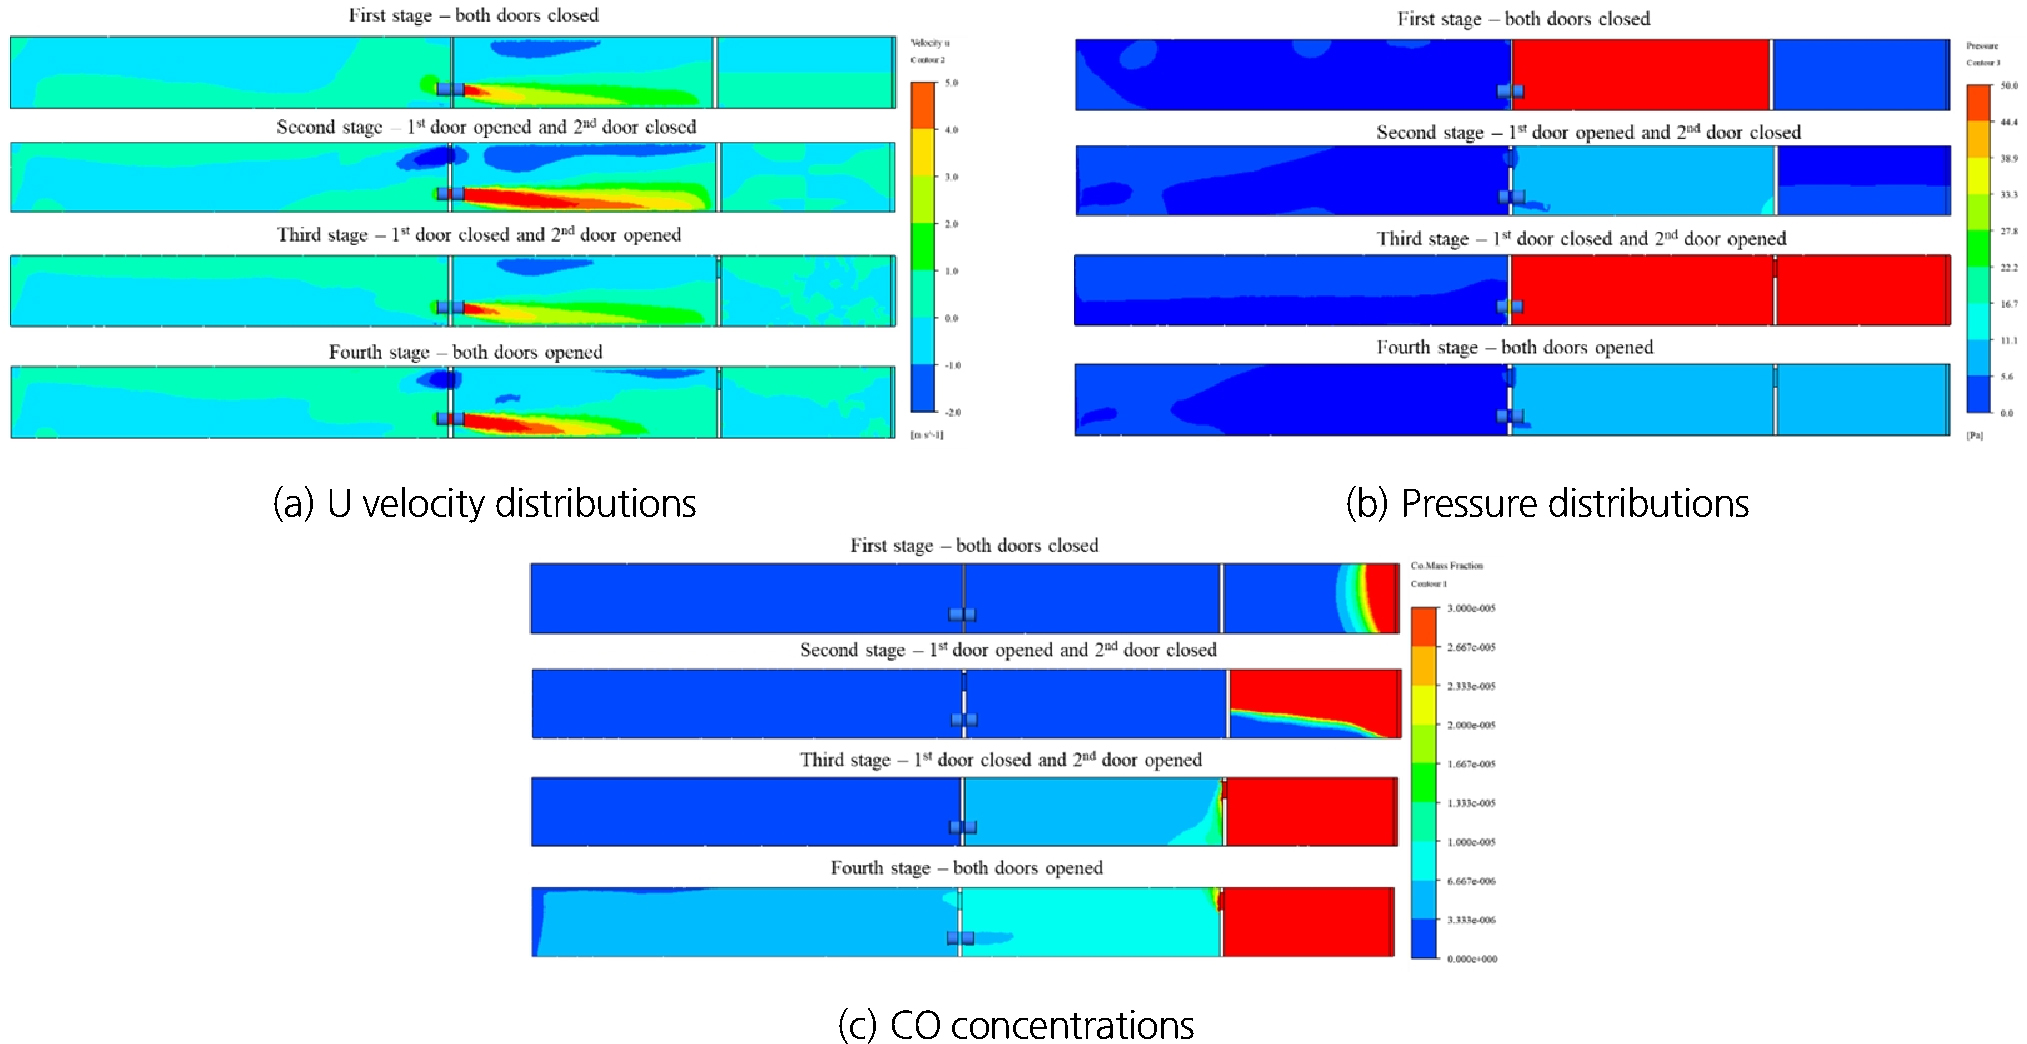
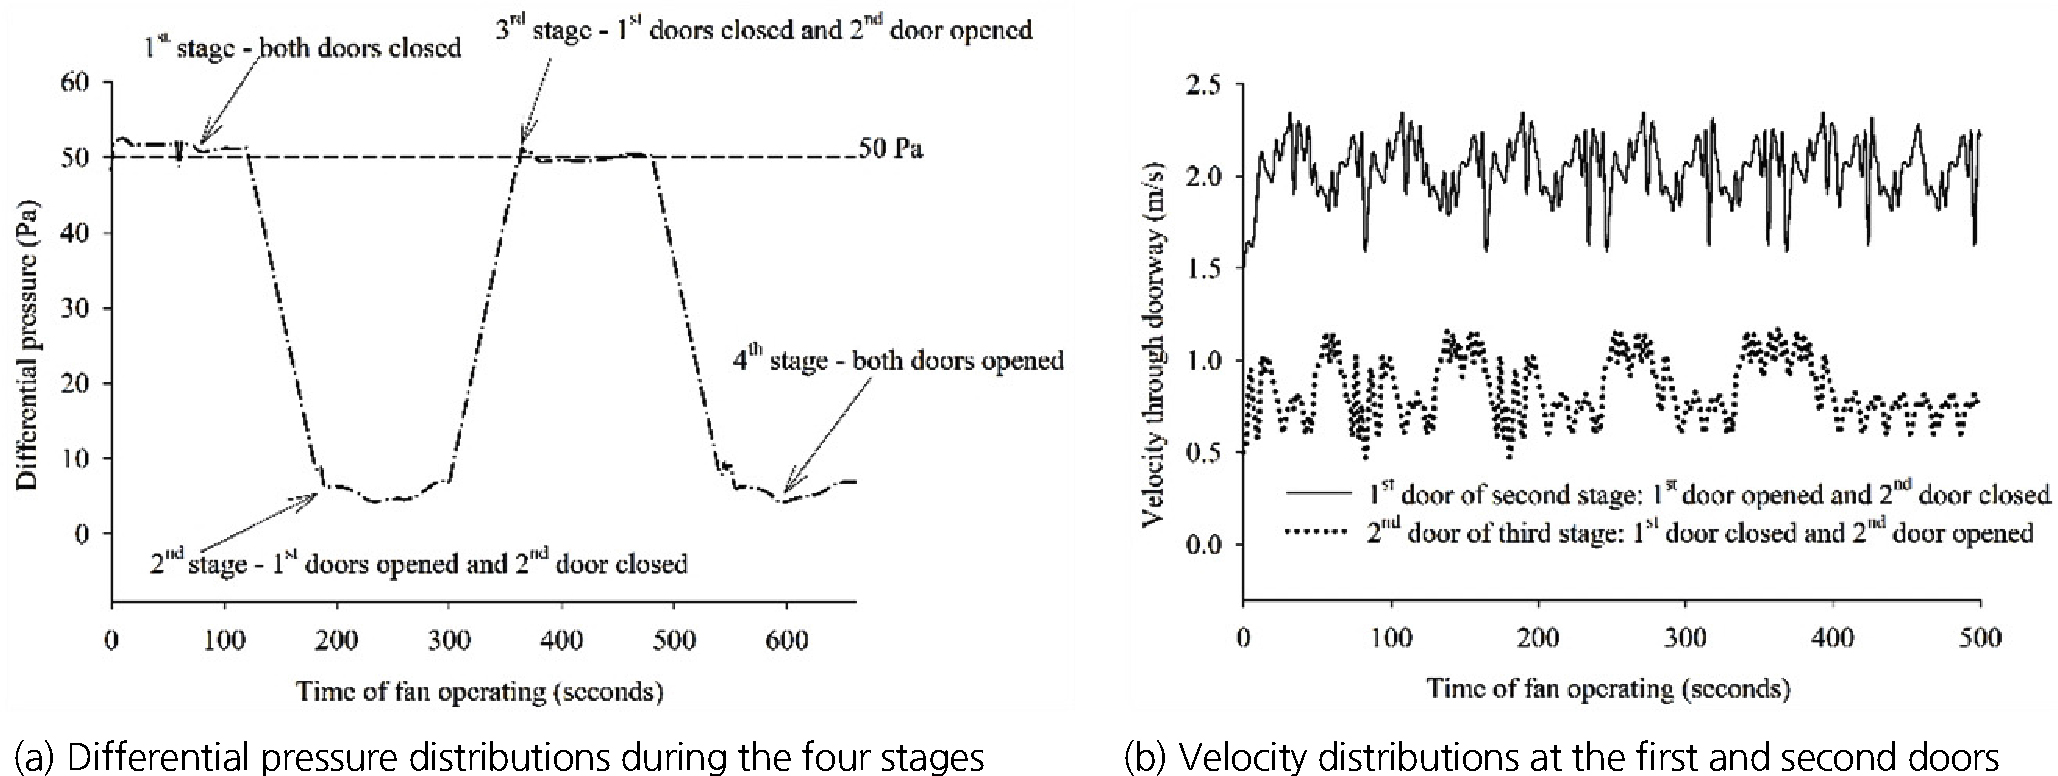
Fig. 7(c) describes the CO concentrations in the four stages. CO distribution profiles are different from the case of pressure profiles since CO concentrations never reached higher than 30 ppm in all stages with a 30 N fan operated. However, in the fourth stage when both doors were opened, CO concentration was in the range of 3-6 ppm outside the first bulkhead zone.
The velocities measured at the first and second doorways are plotted in Fig. 8(b). During the second stage with the first door opened and the second door closed, the average velocity measured at the first door location was 2.0 m/s, while the velocity was 0.83 m/s during the third stage. Thus, even when the first door opened, the minimum velocity at the doorway required for the pressurization was satisfied. This result indicates that the pressurization system with a 30N fan and two bulkheads can be an effective method fulfilling the requirement of the differential pressure of 50 Pa and doorway velocity condition of 2.0 m/s.
3. APPLICABILITY OF THE PRESSURIZATION TECHNIQUES AT A LARGE-OPENING LIMESTONE MINE
3.1 Study method
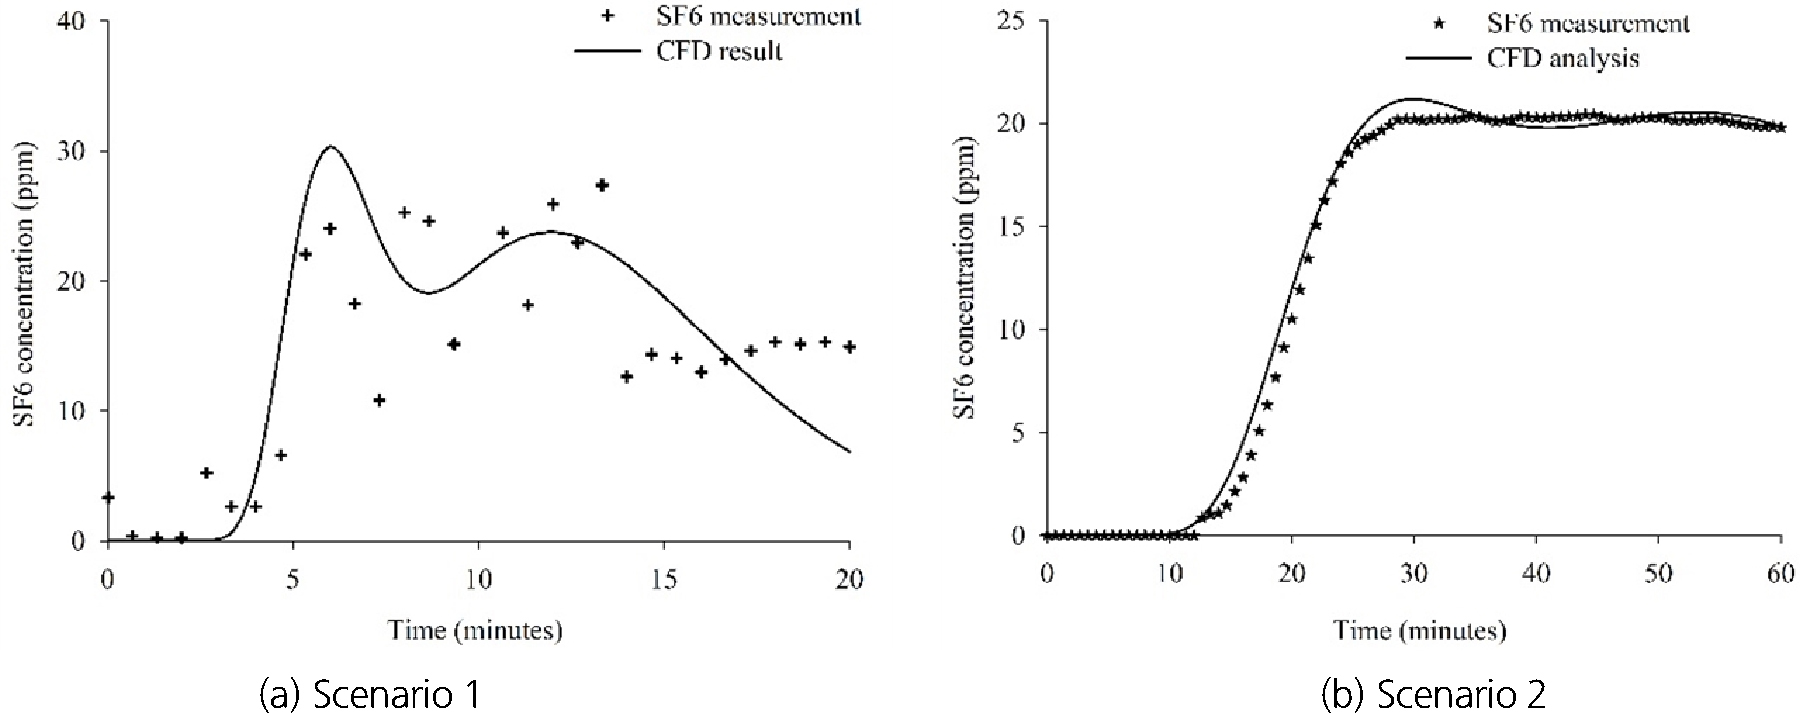
Two site experiments were carried out at D limestone mine in Chungbuk Province to evaluate the applicability of the pressurization techniques and to develop the ventilation scheme for gas leakage and dispersion control at the backfilled underground mine sites. Fig. 9 illustrates the experiment site; the airway dimension was 10 m (W) × 8 m (H) and the entry length driven at the time of the study was about 160 m for the first experiment and 250 m for the second experiment. A 22 KW auxiliary fan was installed on the rampway for the face ventilation and the air was blown towards the working face through 150 m-long Φ 600 mm flexible canvas duct. The duct discharge velocity was approximately 10 m/s. To evaluate the ventilation efficiency, another 37 KW fan was added for the face ventilation. The 22 KW and 37 KW fan specifications are summarized in Table 4.
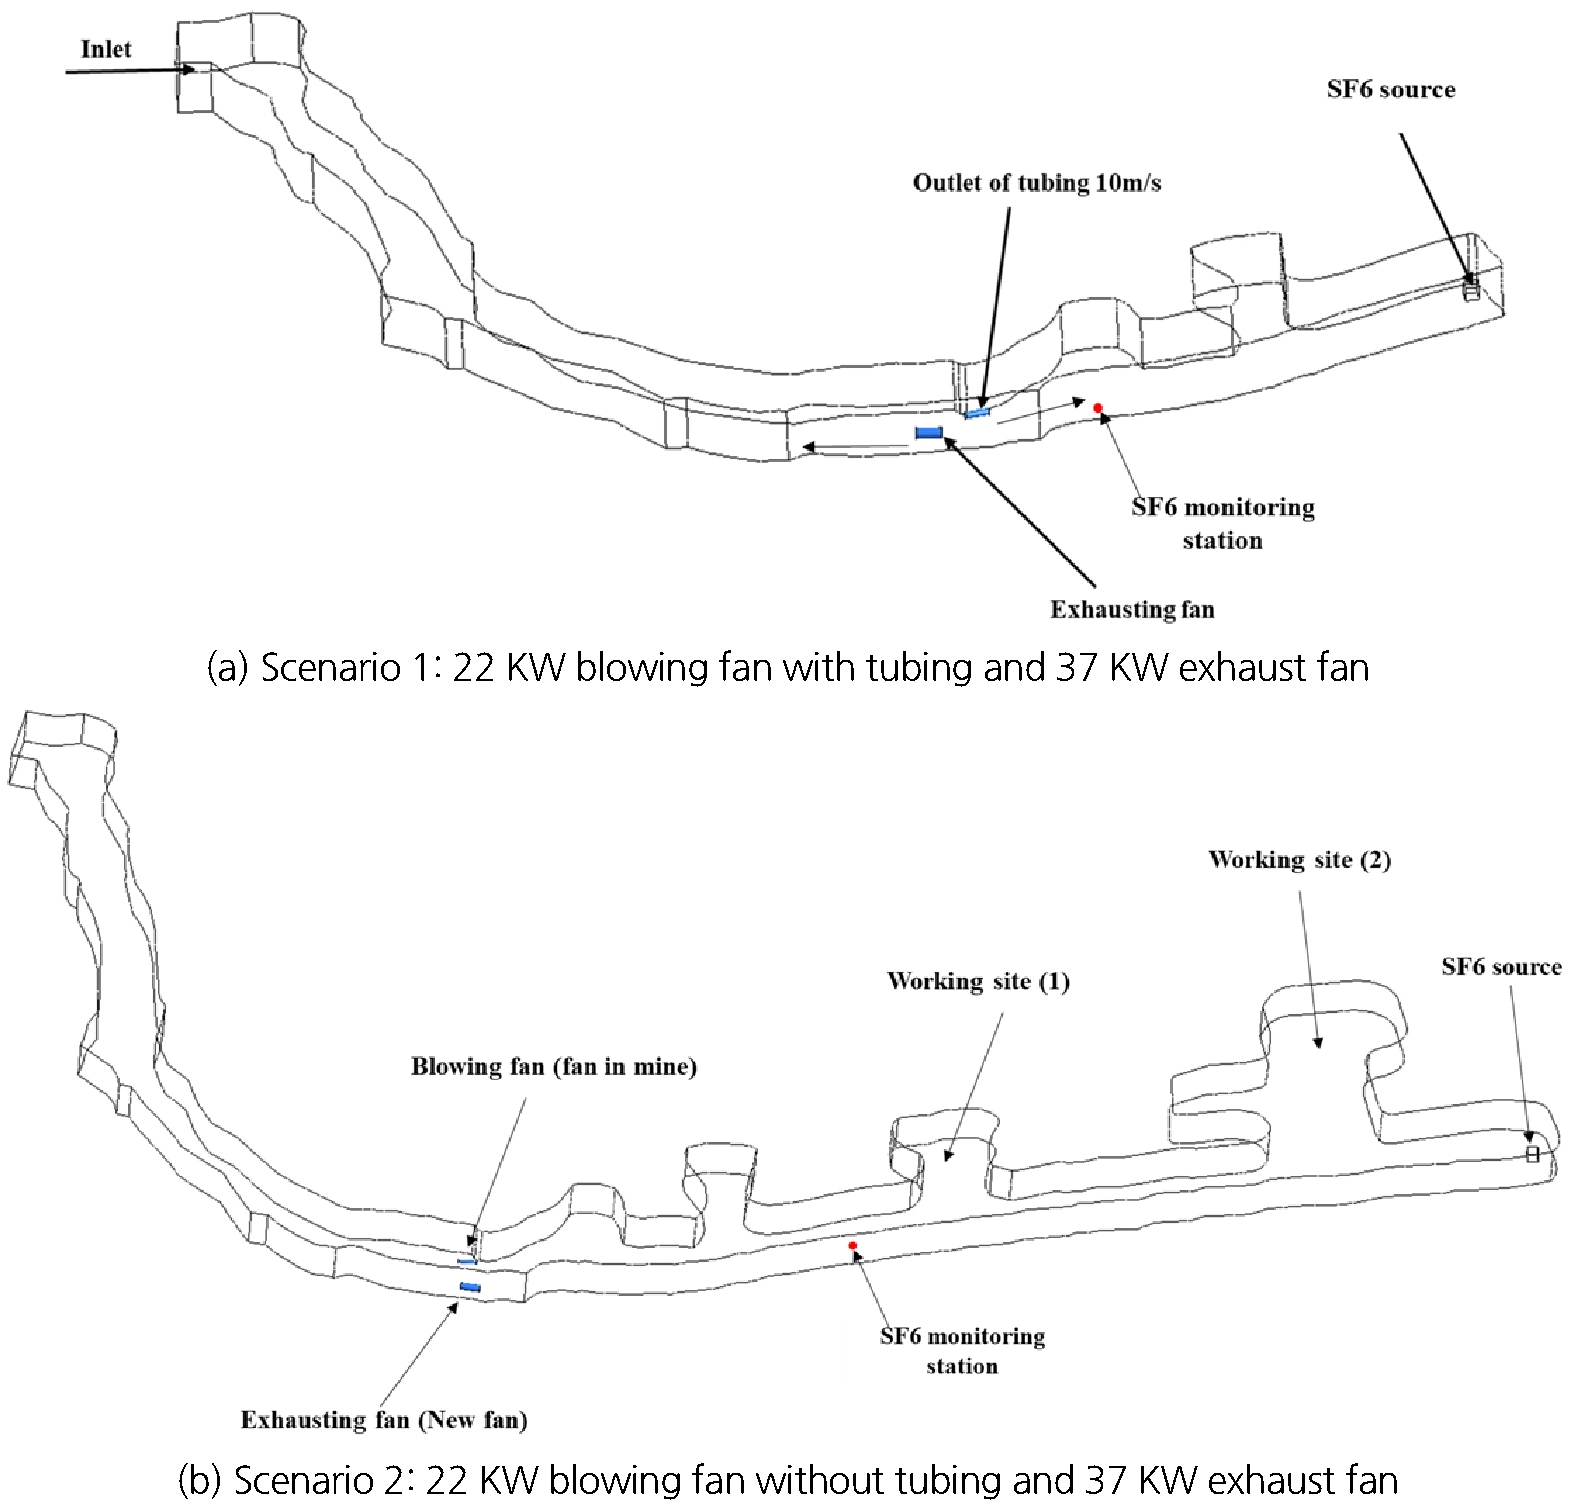
Table 4. Fan specifications for experiment
For the efficiency test of the ventilation system with two fans, two scenarios were designed for the experiment. In Scenario 1, the 37 KW fan was installed at the bottom of rampway and operated in the exhaust mode without tubing, while the 22 KW ducted fan was operated in the blowing mode. This scenario aims to disperse the smoke or pollutants accumulated in the working face by the blowing fan and effectively exhaust them by 37 KW exhaust fan. Meanwhile, in Scenario 2, the tubing attached to 22 KW fan was removed and the fan was relocated to the place where the tubing tip was located. The aim was to increase the turbulent intensity of the air current in the working space by the high-capacity blowing fan and then make pollutant exhaustion easier with lower exhaust velocity. After having installed the two fans in both cases, the fans were turned on at the same time during the normal drilling operation by a diesel-powered drilling machine. To evaluate the efficiency of the pressurization ventilation schemes, CFD analysis was also applied for the comparison purposes. The mine layouts for the CFD analysis are also plotted in Fig. 9; the sites are identical to the two scenarios designed for the site study. A SF6 source was placed at the face and a monitoring station was installed at the middle of the working area to evaluate the airflow pattern.
3.2 Efficiency of the pressurization technique
Fig. 10 illustrates the results of CFD analysis. It is clearly seen in Fig. 10(a) that the jet stream discharged upward by a 37 KW exhaust fan lost most of its momentum when it collided with the rampway wall. After the collision, the air with less momentum was sucked into the blowing fan and discharged through the tubing into the working space. This recirculation phenomenon was evidently observed during the site experiments. The pressure distributions plotted in Fig. 10 shows that the pressurized zone is created near the face in both scenarios. The differential pressures defined as the pressure difference between the pressurized zone and the fan location are approximately 9.5 and 10 Pa in Scenario 1 and 2, respectively. The differential pressure higher than 8Pa will guarantee prevention of gas leak out of the working space to the rampway and then to the upper levels. The working face in Scenario 2 was advanced 90 m further down compared to Scenario 1. The distance to the face was 160 m and 250 m from the fan system in two scenarios, respectively. In Scenario 1, the distance means the distance from the tubing tip. This result indicates the pressurized zone can be created near the face by 20-30 KW auxiliary fans commonly used in local limestone mines if they are installed in the proper manner and within approximately 250 m from the face.
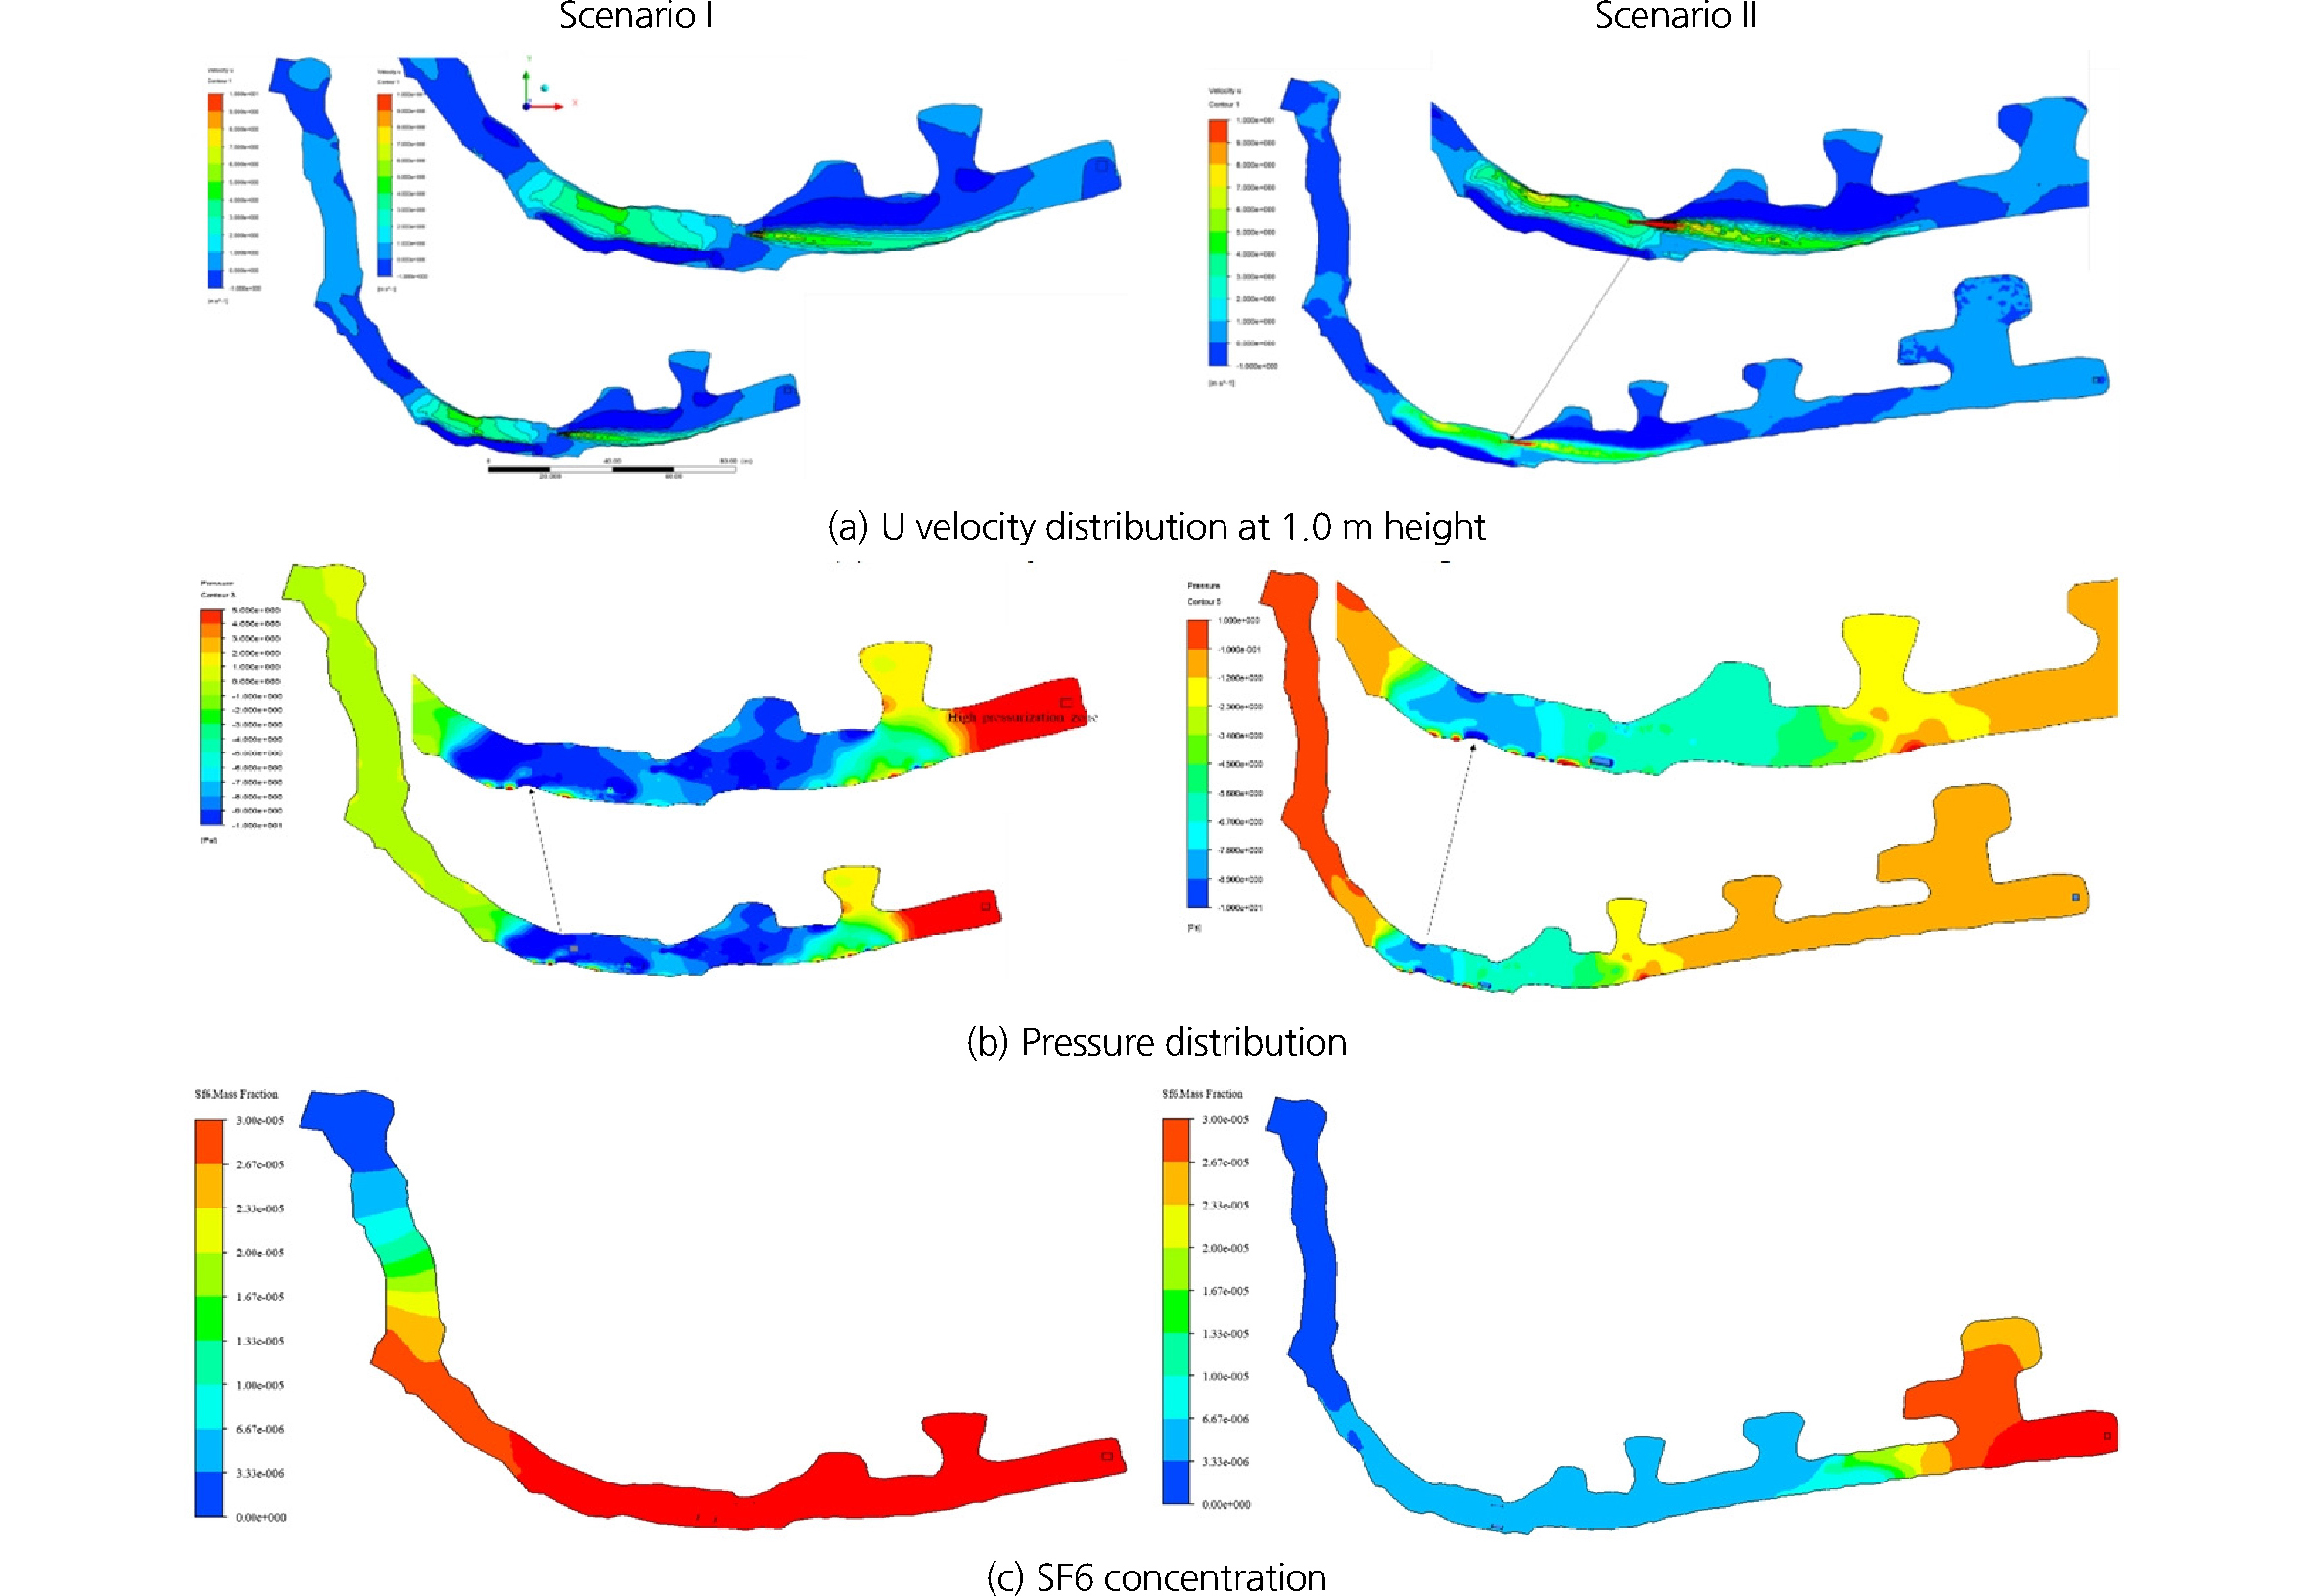
Fig. 10(c) shows the SF6 concentrations. Due to the air recirculation, the SF6 concentrations are found to be above 30 ppm in the space between the blowing fan and the face. The high SF6 concentration zones are almost identical to the high U velocity zones. This figure shows that most of the SF6 gas leaked out from the face is contained in the limited space near the face and remains in the working space for a long period of time when two fans are turned on in blowing and exhaust modes. Since the discharge velocity of the unducted site fan increased significantly from 10 to 38 m/s after the tubing was removed in Scenario 2, the discharged jet stream could reach the face. This is well depicted in Fig. 10(a) showing the U-velocity profiles near the face. As a result, Fig. 10(c) shows significantly reduced the area of high SF6 concentrations and the area with the concentrations higher than 30 ppm is limited to the one cross-cut from the face. This implies that it is possible to control the smoke or pollutants continuously discharged from the face by one blowing fan and one exhaust fan in the large-opening blind face.
Consequently, this conclusion implies that applying two auxiliary fans of 20-30KW in the backfilled working face where gas leakage is concerned can create a pressurized zone near the face and then contain the leaked gas within the working face for a long curing time.
Fig. 11 compares the SF6 concentrations at the monitoring station measured by the site study and CFD analysis. Due to the recirculation phenomenon explained above, the SF6 concentration in Scenario 1 was slightly higher. These were similar to the CFD analysis results in Fig. 10(c) which shows the concentration near the face stabilized in the long run. Thus, these CFD results seem to fit the experiment measurements very well as plotted in Fig. 11. In both scenarios, the pressurization system with two blowing and exhaust fans is shown to control the SF6 concentration below 30ppm in 5 and 20 minutes after turning the fans on in Scenario 1 and 2, respectively. This implies that gas leakage from the backfilled face can be restrained by the pressurization ventilation techniques proposed in this study. However, as shown in the results, the control efficiency largely depends on the fan locations.
4. CONCLUSIONS
This study aims at designing pressurization ventilation methods to control the gas leakage from the backfilled large-opening working face. A series of CFD analysis and site experiments were carried out at a domestic limestone mine. The study results can be summarized as follows:
1.For the pressurization method with a single unducted fan without bulkhead installation, a high capacity 800N fan should be used to maintain the differential pressure of 50 P. Thus, due to the high-cost fan requirement, this type of pressurization system cannot be recommended in large-opening backfilled working faces.
2.A pressurization system with a single bulkhead equipped with a low-capacity 30N fan can satisfy BS 12101-6 and BS 5588-4 requiring the differential pressure of 50 Pa and air velocity of 2.0 m/s at doorway opening. However, the differential pressure reduced to 8 Pa when the door is opened. Thus, great care must be taken to keep the differential pressure above 50Pa when this system is adopted.
3.Installation of two bulkheads with a 30 N fan shows better results to control the leakage and dispersion of the gas emitted from the face. With this technique, the leaked gas can be well restrained in the second pressurized zone by a 30 N fan.
4.To maintain the high pressurization zone, a low-capacity fan such as 30N fan must continue to operate since the differential pressure drops to 0.5-1.0 Pa immediately after turning the fan. In addition, to maintain high pressurized zone, the door should not be open for longer than 1-2 minutes.
5.A pressurization method with a 22 KW blowing fan and a 37 KW exhaust fan was applied to a large-opening working face. Comparison of the CFD analysis and site experiments shows that the system with two unducted fans is very effective to restrain the dispersion of the gas leaked from the face if they are installed in the proper manner and within approximately 250 m from the face. However, the efficiency is largely dependent on the fan locations and the fan operating method.
